Corrective waves are countertrend price movements within the Elliott Wave Theory that retrace or consolidate against the prevailing trend, often appearing as sideways or choppy action.
Developed by Ralph Nelson Elliott, the theory outlines a repeating 5-3 wave cycle—five impulsive waves with the trend, followed by three corrective waves against it—forming part of a larger fractal market structure. Recognizing corrective waves helps traders identify retracement zones, avoid false signals, and time entries within the broader trend.
While understanding Corrective Wave Patterns in Forex Trading is important, applying that knowledge is where the real growth happens. Create Your Free Forex Trading Account to practice with a free demo account and put your strategy to the test.
Key Takeaways
- Corrective waves are short-term price moves against the trend that signal market hesitation or consolidation.
- Zigzags, flats, and triangles are the main corrective patterns, each with a distinct wave structure.
- Combination patterns like W-X-Y and W-X-Y-X-Z link simpler corrections into longer, more complex formations.
- Technical tools like Fibonacci levels, RSI, and MACD help confirm corrective wave setups and manage risk.
- Corrective waves appear on all timeframes and across markets, making multi-timeframe analysis essential.
Types of Corrective Wave Patterns
Corrective wave patterns are primarily categorized into three distinct types: Zigzags, Flats, and Triangles. Each type exhibits specific structural characteristics and internal subwave counts (A-B-C structures).
Zigzag (5-3-5 structure)
A zigzag correction is a sharp, two-legged price movement that significantly corrects the preceding impulse wave. It is characterized by its 5-3-5 subwave structure:
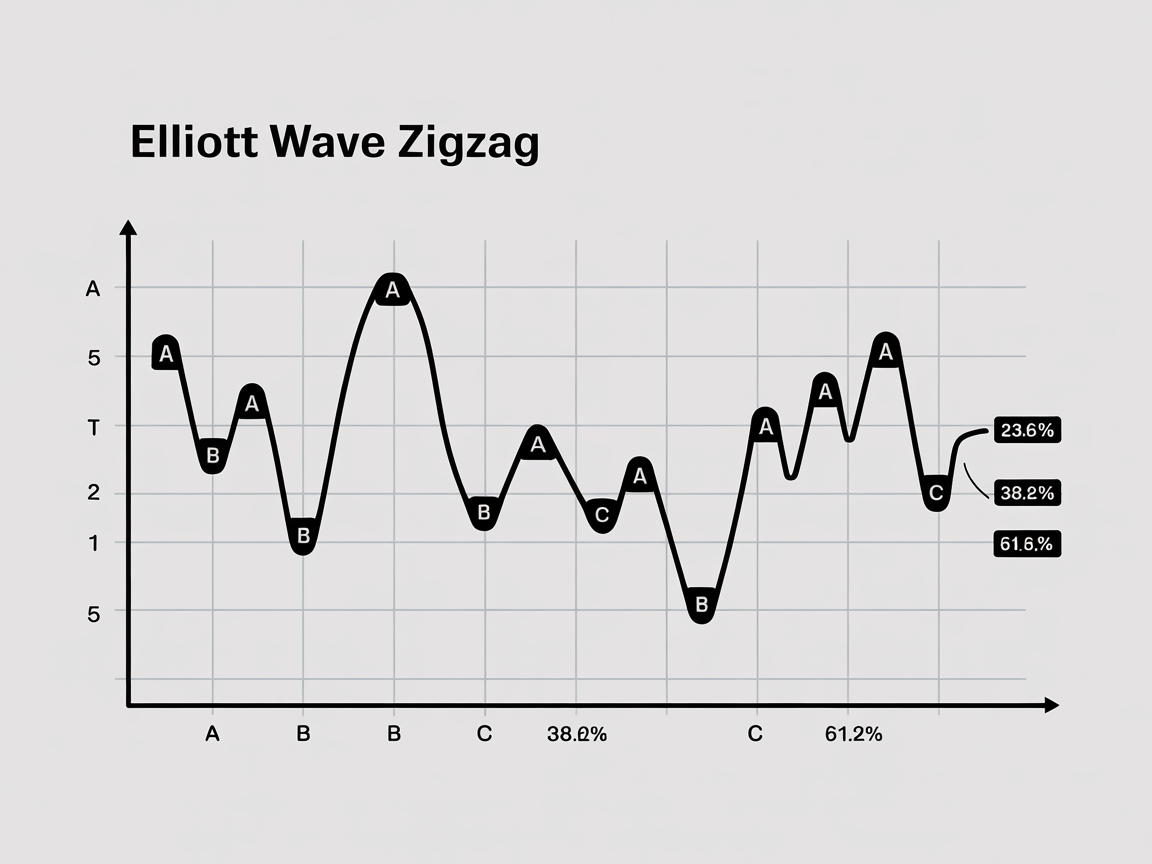
- Wave A: A 5-wave structure moving against the main trend.
- Wave B: A 3-wave structure that typically retraces between 1% and 61.8% of Wave A.
- Wave C: A 5-wave structure that extends beyond the end of Wave A.
Flat (3-3-5 structure)
A flat correction tends to move sideways, indicating a period of consolidation where buyers and sellers are more balanced. It typically has a 3-3-5 subwave structure:
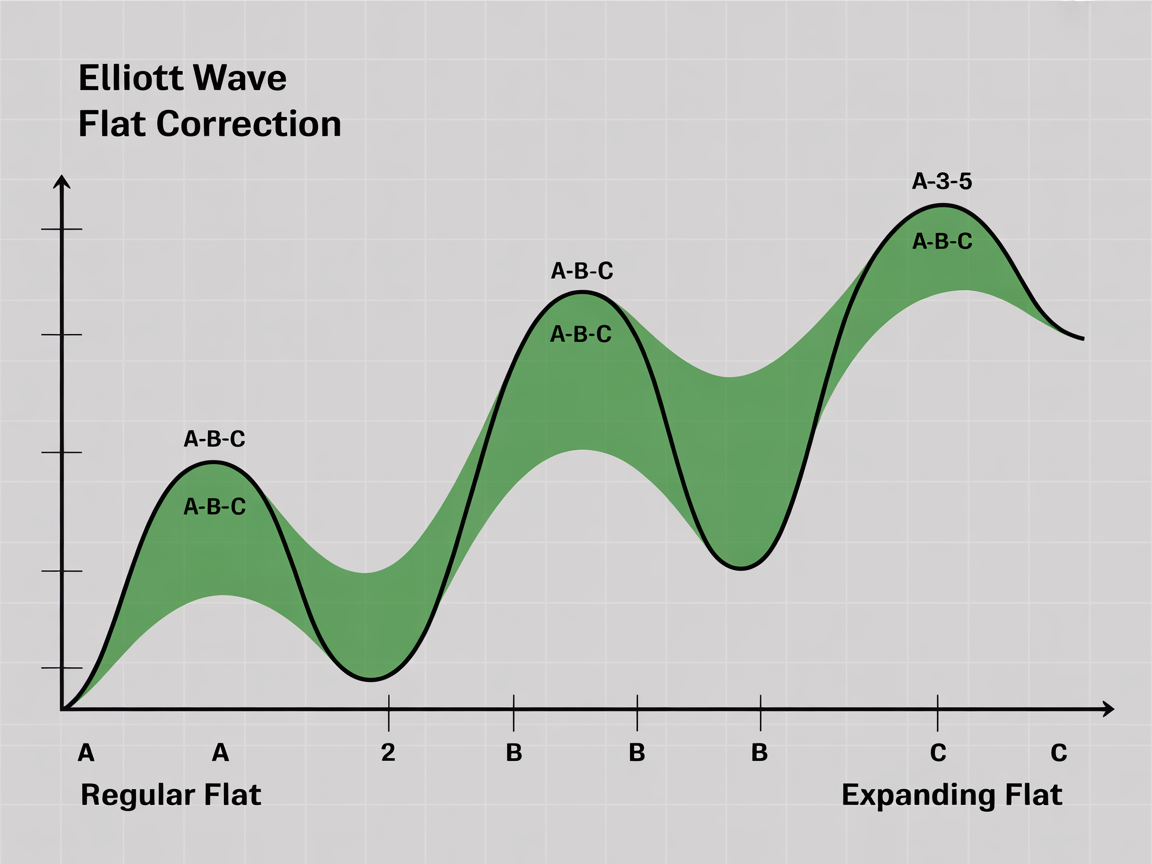
- Wave A: A 3-wave structure.
- Wave B: A 3-wave structure that often retraces a significant portion of Wave A, commonly 61.8% or more, and can even exceed its starting point in an expanding flat.
- Wave C: A 5-wave structure that usually extends beyond the end of Wave A. Variations include regular flats (where Wave B retraces 90-105% of Wave A and Wave C is 100-105% of Wave A) and expanding flats (where Wave B retraces 105-138% of Wave A and Wave C extends beyond Wave A).
Triangle (3-3-3-3-3 structure)
A triangle correction is a sideways, consolidating pattern that typically forms a five-wave (A-B-C-D-E) structure, with each of its subwaves internally subdividing into three waves. Triangles reflect a narrowing price range and can be symmetrical, ascending, descending, or expanding.
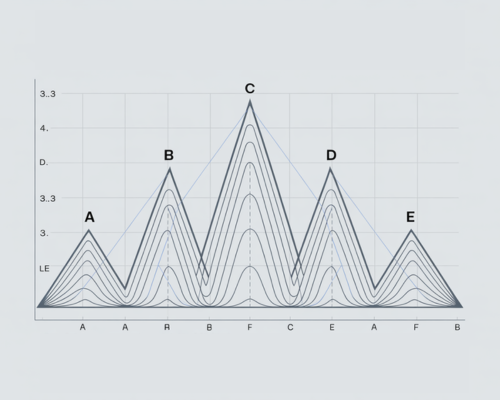
- Structure: 5 waves (A-B-C-D-E), with all waves having a 3-wave internal structure.
- Key Rules: Wave B should be between 38.2% and 261.8% of Wave A, but not equal to Wave A. In a triangle, at least three of the waves from B to E should retrace at least 50% of the prior wave. A false breach of the 0-B trend line can indicate a developing triangle.
Guidelines and Rules for Corrective Waves
Corrective wave formations adhere to specific guidelines and rules that aid in their identification and validation within the Elliott Wave framework.
Guideline of Alternation
The guideline of alternation suggests that if Wave 2 of an impulse is a sharp, deep correction (like a zigzag), then Wave 4 will likely be a more complex, sideways correction (like a flat or triangle), and vice versa. This principle also extends to corrective patterns themselves, where simpler corrective waves tend to alternate with more complex ones.
Fibonacci Relationships
Fibonacci retracement and extension levels are critical for identifying potential termination points for corrective waves and serve as key support and resistance areas.
- Common Retracement Levels: The most frequently observed Fibonacci retracement levels are 38.2%, 50%, and 61.8%.
- Specific Corrective Relationships:
- In zigzags, Wave B commonly retraces between 38% and 79% of Wave A. Waves A and C often show equality in length (100% relation).
- In flats, Wave B typically retraces more than 61.8% of Wave A.
- In expanding triangles, specific relationships like Wave C being 161.8% of Wave A, Wave D 161.8% of Wave B, and Wave E 161.8% of Wave C are common.
- Fibonacci Extensions: These are used to project potential future price targets, with important levels at 100%, 138.2%, and 161.8%. For example, Wave C often extends to 100%-161.8% of Wave A.
Validation and Common Rule Violations
While corrective waves are generally more complex and allow for more variation than impulsive waves, certain structural rules must be followed to maintain a valid wave count. Common rule violations that invalidate a corrective pattern include:
- Zigzag: Violation of the 5-3-5 internal subwave count for A-B-C, or Wave C failing to extend beyond Wave A.
- Flat: Violation of the 3-3-5 internal subwave count for A-B-C.
- Triangle: Violation of the 3-wave internal structure for any of its A-B-C-D-E waves, or the pattern breaking out prematurely in the wrong direction without fulfilling its internal wave count.
Ready to Elevate Your Trading?
You have the information. Now, get the platform. Join thousands of successful traders who use Volity for its powerful tools, fast execution, and dedicated support.
Create Your Account in Under 3 MinutesCombination Corrective Patterns (W-X-Y, W-X-Y-X-Z)
Beyond the basic zigzag, flat, and triangle patterns, corrective waves can form more complex sequences known as combination patterns, which combine simpler corrective structures using “connector” waves.
Double Three (W-X-Y)
A Double Three pattern consists of two simple corrective patterns (W and Y) connected by an intervening corrective wave (X).
- Structure: Wave W is a simple corrective pattern (zigzag, flat, or triangle). Wave X is a corrective wave that connects W and Y. Wave Y is also a simple corrective pattern.
- Rules: There can be a maximum of one zigzag and one triangle in the W and Y positions. The X wave can be any corrective pattern, including smaller combinations.
- Occurrence: Double Threes often occur to extend the duration of a corrective phase, allowing the market to meet specific price targets or channel lines before resuming the primary trend. They typically represent sideways price activity.
Triple Three (W-X-Y-X-Z)
A Triple Three pattern is a rarer and even more complex combination, consisting of three simple corrective patterns (W, Y, and Z) connected by two intervening corrective waves (X).
- Structure: Similar to the Double Three, but with an additional simple corrective pattern (Z) and another connector wave (X).
- Occurrence: These patterns are considered very rare and are usually observed in prolonged sideways consolidations.
Fractal Nature of Corrective Waves
The fractal nature of corrective waves is a fundamental aspect of Elliott Wave Theory, meaning that these patterns repeat themselves across all timeframes and scales. This concept of “waves within waves” implies a consistent hierarchy where every wave is composed of smaller sub-waves, and simultaneously, every wave is part of a larger wave.
- Timeframe Nesting: A corrective wave identified on a daily chart, for example, will itself be composed of smaller, discernible corrective and impulsive patterns on a 4-hour or 1-hour chart. Conversely, a large-degree corrective wave on a monthly chart will encompass numerous smaller-degree corrections and impulses on daily or weekly charts.
- Multi-Timeframe Analysis: Understanding this fractal property enables traders to gain a comprehensive perspective of market structure, improving their ability to identify trends, potential reversals, and optimal entry/exit points across different time horizons. A correction on a higher timeframe may appear as a complex combination of smaller corrections on a lower timeframe.
Real-Time Wave Analysis: Identification, Tools, and Common Mistakes
Successfully navigating corrective waves in real-time trading charts requires a systematic approach that combines meticulous wave counting with the intelligent application of technical indicators, while also being aware of common pitfalls.
Identification Tips and Wave Counting
- Start with Higher Timeframes: Begin by analyzing weekly or daily charts to identify the larger trend and primary wave structures, then drill down to lower timeframes (e.g., 4-hour, 1-hour) for detailed counting.
- Look for 3-Wave Structures: The hallmark of a corrective wave is its 3-wave (A-B-C) pattern moving against the main trend.
- Confirm Subwave Counts: Verify that the internal subwave structures align with the characteristics of zigzags (5-3-5), flats (3-3-5), or triangles (3-3-3-3-3).
- Observe Retracement Depths: Pay attention to how deeply a corrective wave retraces the preceding impulse. For instance, Wave B in a zigzag typically retraces 50-61.8% of Wave A.
- Practice and Patience: Wave counting can be subjective and requires significant practice to accurately discern patterns in live market conditions. Using three aligned timeframes (e.g., weekly, daily, 4-hour) can help ensure consistency.
Indicator-Based Confirmation & Risk Management
Technical indicators provide crucial confirmation for wave counts and aid in risk management. This applies across all markets, including volatile ones like crypto and Forex.
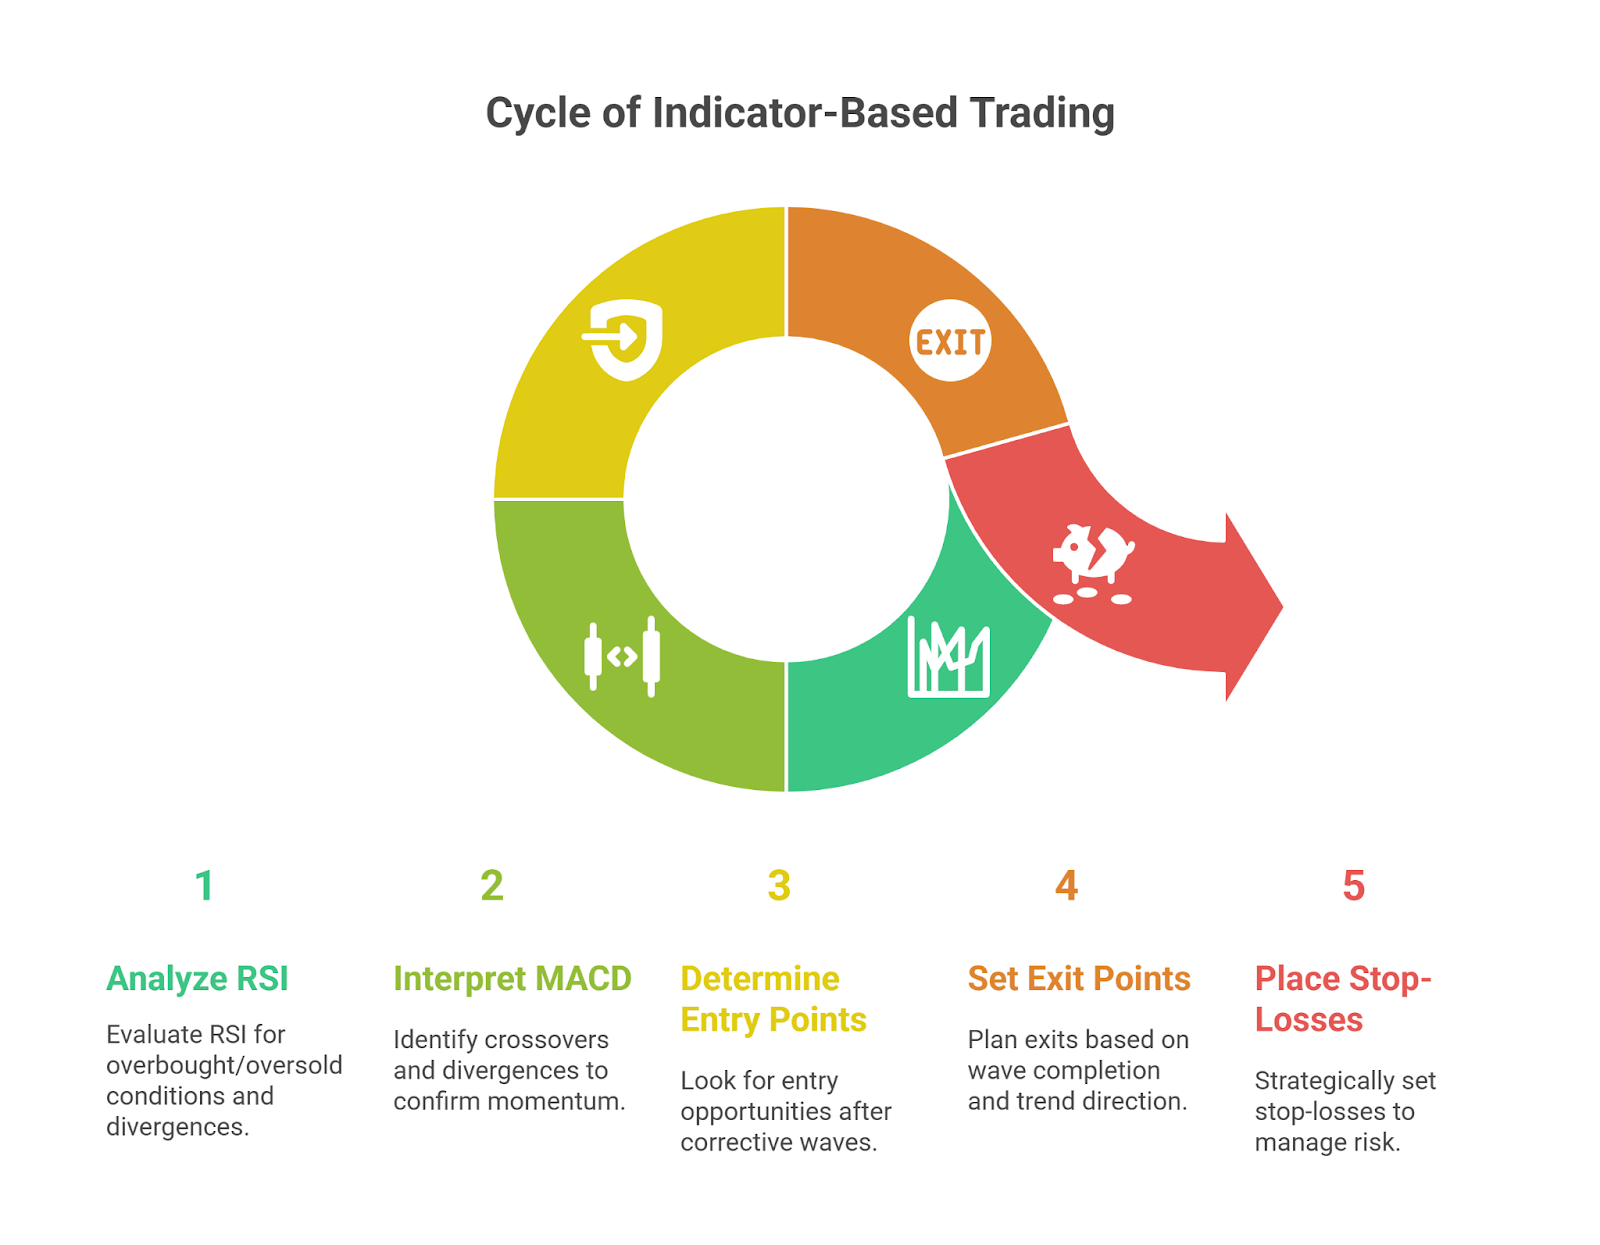
- RSI (Relative Strength Index):
- Divergence: A bearish divergence between price and RSI (Relative Strength Index) at the end of an impulsive Wave 5 can signal an impending correction.
- Overbought/Oversold: During corrective phases, the RSI may move into oversold (below 30) or overbought (above 70) territory, which can indicate potential turning points for the next impulsive move.
- MACD (Moving Average Convergence Divergence):
- Crossovers: A bearish MACD crossover can confirm downward momentum during a corrective phase, while a bullish crossover may signal the completion of a correction and the start of a new impulse.
- Divergence: MACD divergence can also confirm the end of a wave sequence and signal a reversal.
- Entry/Exit Signals:
- Entry: Look for entry opportunities upon the confirmed completion of a corrective wave, typically at the end of Wave C (or Wave E in a triangle). Confirm with bullish (for upward trend continuation) or bearish (for downward trend continuation) price action patterns.
- Exit: Short-term traders might look to exit positions at the completion of a corrective wave if trading against the larger trend. For long-term trades, partial profits can be taken during the powerful Wave 3 of the subsequent impulse.
- Stop-Loss Placement: Implementing strict stop-loss orders is paramount to manage risk. Place stop-losses strategically, for instance, below the low of Wave 2 (for Wave 1/2 entry) or below the peak of Wave 1 (for Wave 3 entry), as Wave 4 should not overlap Wave 1 in an impulse.
Common Mistakes to Avoid
- Mislabeling Waves: The most frequent error is incorrectly labeling waves, particularly confusing corrective structures with impulsive ones or miscounting the sub-waves within a correction. This often stems from a lack of patience or trying to force a pattern where one doesn’t exist.
- Ignoring Rules/Violations: Failing to adhere to pattern-specific rules (e.g., internal subwave counts, retracement limits) or basic Elliott Wave principles (like the guideline of alternation) can lead to invalid counts and incorrect trading decisions.
- Overcomplicating Structures: Sometimes, a correction is a straightforward zigzag or flat. Overthinking and trying to fit a complex combination pattern into a simple correction can lead to unnecessary confusion.
- Over-reliance on a Single Indicator: Using only Elliott Wave counting without confirming signals from other technical indicators can result in errors.
- Forcing Wave Counts: Attempting to rigidly predict the exact path of a corrective wave rather than reacting to its developing structure in real-time is a common pitfall. Test multiple scenarios instead of sticking to one.
- Time Frame Selection Errors: Inconsistent analysis across different timeframes can lead to misjudgments. Forgetting the fractal nature and failing to align macro and micro wave counts can result in a distorted view of the market.
Corrective Wave Patterns in Crypto and Forex
Elliott Wave Theory is widely applied in high-volatility markets such as cryptocurrency (Crypto) and Forex due to their underlying psychological drivers. The principles of corrective waves remain consistent across these markets, though their manifestation can be influenced by market-specific characteristics.
- General Application: The fundamental zigzag, flat, and triangle corrective patterns are observed in both crypto pairs (e.g., BTC/USD, ETH/USD) and Forex pairs (e.g., GBP/USD).
- Volatility Impact: Crypto markets are particularly emotional and volatile, which can lead to more exaggerated or extended corrective movements. This can make clear identification of the A-B-C structure challenging at times, but also presents significant trading opportunities. In highly liquid and fast-moving Forex markets, corrective patterns can unfold rapidly, demanding prompt analysis.
- Risk Management Implications: Due to the inherent subjectivity of Elliott Wave counting, especially in volatile markets, combining Elliott Wave analysis with other technical tools is crucial for confirmation and reducing subjectivity. Strict stop-loss orders are paramount to protect capital against unexpected price movements or incorrect wave counts.
Turn Knowledge into Profit
You've done the reading, now it's time to act. The best way to learn is by doing. Open a free, no-risk demo account and practice your strategy with virtual funds today.
Open a Free Demo AccountBottom Line
Corrective wave patterns are key to identifying market retracements within the Elliott Wave Theory. The main types—zigzags (5-3-5), flats (3-3-5), and triangles (3-3-3-3-3)—follow clear structures and help traders distinguish between consolidation and trend reversal.
More complex corrections like W-X-Y and W-X-Y-X-Z link simple patterns to extend the corrective phase. These formations appear across all timeframes and markets, including crypto and forex.
Effective identification involves wave counting, Fibonacci tools, and indicators like RSI and MACD. Common errors include mislabeling waves, ignoring rules, and overcomplicating patterns.
Understanding and applying these principles improves trade accuracy and market timing.