Moving averages are among the most trusted technical indicators in forex trading. You use them to track trends, filter out market noise, and make better entry or exit decisions. Two of the most popular forms are the Exponential Moving Average (EMA) and the Simple Moving Average (SMA). Both follow price trends, yet each works in a different way and serves a different purpose.
In this guide, you will understand how EMA and SMA function, where they differ, and how to decide which one to use for your trades. You will also see how combining them can give stronger, more reliable trading signals.
While understanding EMA vs SMA is important, applying that knowledge is where the real growth happens. Create Your Free Forex Trading Account to practice with a free demo account and put your strategy to the test.
Key Takeaways
- EMA and SMA are both trend-following technical indicators.
- EMA reacts faster to recent price changes by giving more weight to the latest data.
- SMA smooths price action by giving equal weight to all data in the period.
- EMA suits short-term, momentum-driven strategies.
- SMA suits long-term trend analysis and stability.
- There shouldn’t be any comparison between EMA and SMA in terms of betterment.
- EMA and SMA should be combined to improve entry timing and trend confirmation.
Both EMA and SMA are Trend-Following Indicators
EMA and SMA are technical indicators used in Forex trading to read market trends. Both belong to the trend-following category because they track the direction of price over time. You can apply them to spot whether the market is moving up, down, or holding in a range.
More clearly, you can use EMA and SMA indicators to:
- Stay aligned with the dominant trend.
- Mark dynamic support and resistance zones.
- Time trades using crossovers or pullback entries.
Let’s say you open a daily chart of EUR/USD and plot a 50-period SMA. If the line slopes upward and price stays above it, you know buyers are in control. That tells you to focus on buying opportunities.
Now look at a 4-hour chart of GBP/JPY with a 200 EMA. In an uptrend, price often dips to that EMA before bouncing higher. That bounce can be your entry signal, giving you a low-risk trade in the direction of strength.
So, both indicators aim to guide you through the market’s bigger picture. EMA reacts faster to new prices. SMA moves more slowly and gives you a steadier read. Your choice depends on how quickly you want to respond to what the market is doing right now.
But there are differences between EMA and SMA
You already know both are moving averages. The difference comes down to how they treat price data.
SMA gives equal weight to every price in the period you choose. If you set a 20-period SMA, each of those 20 closing prices influences the line the same way. That makes it smooth and steady, but also slower to react when the market changes direction.
EMA gives more weight to the most recent prices. In a 20-period EMA, the price from today counts more than the price from two weeks ago. That weighting makes it more responsive to current market moves and quicker to pick up on new trends.
You’ll feel the difference between EMA and SMA when you trade:
- EMA hugs price more closely and turns faster when the market shifts.
- SMA lags a bit more but keeps you from reacting too quickly to small, random spikes.
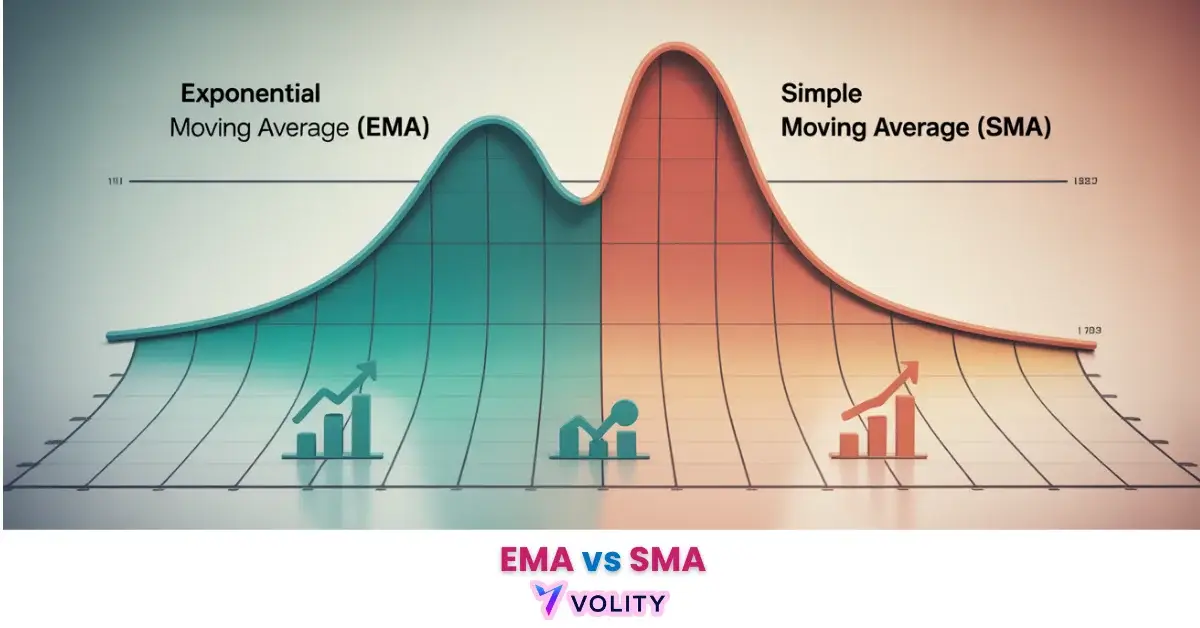
EMA vs SMA: Key Differences in Forex Trading
Here’s how Simple Moving Average (SMA) and Exponential Moving Average (EMA) differ in calculation, behaviour, and trading use.
| Feature | SMA (Simple Moving Average) | EMA (Exponential Moving Average) |
| Type | Trend-following technical indicator | Trend-following technical indicator |
| Calculation Method | Gives equal weight to all prices in the selected period | Gives more weight to the most recent prices |
| Reaction Speed | Slower to react to new price changes | Faster to react to new price changes |
| Chart Appearance | Smoother, more gradual curves | Closer to price action, turns more sharply |
| Sensitivity to Spikes | Less sensitive, smooths out sudden moves | More sensitive, reacts quickly to sudden moves |
| Best Use Case | Swing trading, long-term trend analysis | Scalping, day trading, short-term trend detection |
| Risk of False Signals | Lower, due to reduced sensitivity | Higher, especially in choppy markets |
| Common Periods | 50, 100, 200 | 10, 20, 50 |
EMA VS SMA: Which Moving Average Should You Use in Forex?
You already know that both EMA and SMA are reliable trend-following tools. The real question is how to decide which one fits your trading style. Your answer depends on how fast you want your signals and how much market noise you can handle.
If you trade on short timeframes, EMA gives you an edge. Its quicker reaction to price changes means you see trend shifts earlier and can jump in while the move still has momentum. For example, day traders often use a 10 or 20-period EMA on the 5-minute chart to catch intraday swings. Babypips points out that the extra sensitivity helps you align with “what traders are doing now,” which is key when every minute counts.
If you prefer longer-term stability, SMA works better. Because it averages all prices equally, it smooths out sudden spikes and keeps your focus on the broader trend. A 50 or 200-period SMA on the daily chart helps you filter out short-term noise and stick to high-probability setups. Morpher’s research highlights that this slower pace reduces false entries, which can protect your account in ranging markets.
Let’s take a quick look at real-time insights from traders. We have found that the majority of scalpers prefer EMA for short time frames because its weighting on recent prices makes it react faster, and thus helps catch quick moves. On the other hand, SMA is still used for longer-term levels (like 200-period) to identify major trend direction. Several traders combine both. For example, using a short EMA for fast crossovers with a longer SMA for broader trend confirmation. The consensus is that no moving average works alone, and you must combine them with price action and support/resistance. Some traders also compare Ichimoku Cloud vs moving averages to decide whether they prefer a full-market view with multiple components or the simplicity of EMA/SMA crossovers.
So, the bottom line is that you should:
- Use EMA when you need speed, quick reversals, and sharper entries.
- Use SMA when you want stability, reduced noise, and a long-term perspective.
- Use both to balance agility and reliability in your strategy.
Ready to Elevate Your Trading?
You have the information. Now, get the platform. Join thousands of successful traders who use Volity for its powerful tools, fast execution, and dedicated support.
Create Your Account in Under 3 MinutesWhat Happens When EMA Crosses SMA?
When an EMA crosses an SMA on your forex chart, it signals a potential change in market momentum. Because the EMA reacts faster to recent price movements, its position relative to the slower SMA tells you which side of the market has the upper hand.
- EMA crossing above SMA – This suggests bullish momentum is building. Buyers are pushing prices higher in the short term, and the market may be entering an uptrend. Many traders treat this as a possible buy signal, especially if it aligns with the overall trend direction.
- EMA crossing below SMA – This indicates bearish pressure. Sellers are dominating in the short term, and the market may be shifting into a downtrend. Traders often see this as a potential sell signal.
You should know that the strength of this signal increases when:
- The cross happens after a period of consolidation.
- It aligns with higher-timeframe trend direction.
- Price breaks key support or resistance levels at the same time.
However, a crossover is not supposed to be taken as a guaranteed reversal. EMA-SMA crosses can produce false signals in ranging or choppy conditions. That’s why many traders confirm the crossover with other tools like MACD, RSI, or price action before committing to a trade.
How to Use SMA and EMA Together for Stronger Signals?
So now it is important to see how SMA and EMA can work together to sharpen trade decisions.
Both indicators track market trends, but each handles data differently. SMA smooths price action and offers a steady view of the market’s long-term bias. EMA reacts faster to recent changes, highlighting short-term momentum. Combine both and you’ll be able to read the broader trend while catching early signs of acceleration or reversal.
Here’s what you need to do:
Step 1 – Set the foundation with a long-term SMA
You can go for a 100-period or 200-period SMA, setting it as the backbone of this method. Price action above the SMA reflects a bullish market environment. Price action below it signals a bearish backdrop. For example, on the EUR/USD daily chart, a 200-period SMA can show a year-long upward bias even if short-term pullbacks occur.
Step 2 – Track short-term changes with a faster EMA
A 10-period or 20-period EMA sits closer to price action and reacts faster to new information. On the same EUR/USD chart, a 20 EMA might slope upward before the SMA does, giving an early sign of renewed bullish strength. You’ll see how this helps identify points where momentum begins to align with the larger trend.
Step 3 – Look for EMA-SMA alignment
You can create a high-probability setup only if the EMA moves in the same direction as the SMA. For example, during an uptrend defined by the SMA, the EMA climbing above the SMA often signals strong buying pressure. In a downtrend, the EMA dropping under the SMA confirms growing selling strength. Remember that alignment is important to reduce the risk of entering trades against the dominant trend. For traders who want to go further, the Guppy Multiple Moving Average (GMMA) expands on this EMA–SMA concept by layering multiple EMAs to track both short-term momentum and long-term investor sentiment, making trend confirmation even stronger
Step 4 – Validate with supporting evidence
You can gain additional confirmation from MACD crossovers, RSI readings, or bullish/bearish candlestick formations. A bullish engulfing candle forming right after the EMA crosses above the SMA can serve as an extra layer of confidence. Such filters protect against entering trades in choppy, sideways conditions.
Step 5 – Apply multi-timeframe analysis
A trader can check the same EMA-SMA relationship on both the 4-hour and daily charts. If the daily chart shows price above both averages and the 4-hour chart shows a fresh EMA crossover, the trade gains stronger backing from multiple perspectives.
Turn Knowledge into Profit
You've done the reading, now it's time to act. The best way to learn is by doing. Open a free, no-risk demo account and practice your strategy with virtual funds today.
Open a Free Demo AccountFinal Thoughts
EMA and SMA differ from each other in the way they process price data and the type of insight they provide. EMA’s sensitivity to recent prices makes it ideal for capturing momentum shifts before many traders react. SMA’s smoothing effect helps you maintain focus on the bigger trend without distraction from short-term price noise.
You can go for EMA if you want a faster reaction to current market moves. Or you can choose SMA if you prefer a steady, less volatile view of the market. But remember that neither is inherently better.
In fact, the strongest results often come from combining both: SMA sets your overall trend bias, while EMA gives you the precise moment to enter or exit.