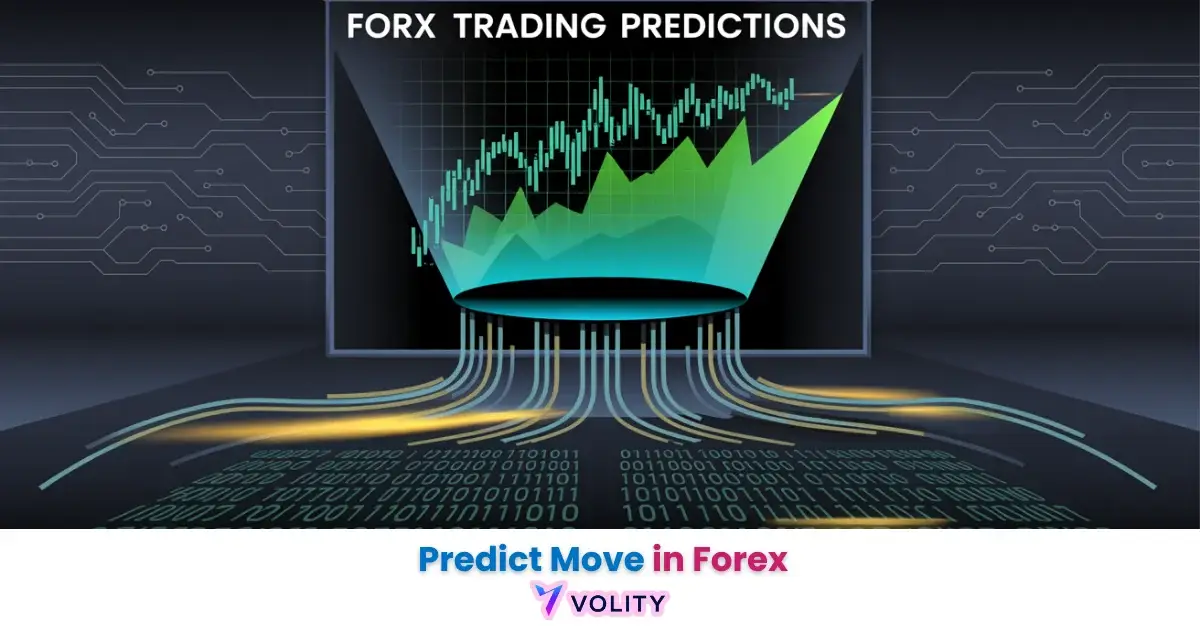
The forex market offers immense liquidity and 24/5 trading opportunities, making effective price prediction crucial for successful trading strategies. This comprehensive guide explores how to anticipate currency pair fluctuations by integrating technical, fundamental, and psychological analysis. You will learn to identify key market drivers, interpret chart patterns, manage emotional biases, and implement robust risk management techniques to improve your forecasting accuracy.
While understanding How To Predict Move In Forex Trading is important, applying that knowledge is where the real growth happens. Create Your Free Forex Trading Account to practice with a free demo account and put your strategy to the test.
What are the best ways to predict forex movements?
The best ways to predict forex movements involve a combination of technical analysis, fundamental analysis, and an understanding of market psychology. These approaches provide different lenses through which to view currency pairs, offering a more complete picture of potential price direction. Technical analysis focuses on chart patterns and indicators, while fundamental analysis examines economic data and geopolitical events. Psychology considers the collective behavior of traders.
Can you reliably predict forex?
You can reliably predict forex movements to a degree, primarily by focusing on probabilities rather than certainties. The forex market is influenced by numerous complex factors, making 100% accurate prediction impossible. However, by employing structured analytical methods and robust risk management, traders can increase their odds of making profitable forecasts.
Professional traders emphasize managing risk over perfect prediction accuracy.
Technical Analysis for Forex Prediction
Technical analysis is a primary method for predicting forex movements, focusing on historical price data to identify patterns and forecast future price action. This approach operates on the principle that market prices reflect all available information, and historical price behavior tends to repeat itself. It involves studying past market data, primarily price and volume, to predict future price movements. Traders use various tools like chart patterns, indicators, and support and resistance levels to interpret market sentiment and potential direction, aiming to identify high-probability entry and exit points for currency pairs.
Over 80% of retail forex traders use technical analysis to identify patterns and predict future price movements. This widespread adoption underscores its perceived value in the trading community.
What are common forex indicators?
Common forex indicators are mathematical tools calculated from price, volume, or open interest data that help traders forecast market direction. These indicators are broadly categorized into trend-following, momentum, volatility, and volume indicators. Each type offers a different perspective on market dynamics, aiding in the identification of potential bullish and bearish trends.
Selecting reliable indicators often depends on a trader’s specific trading strategy and timeframe.
| Indicator | Type | How it Predicts |
| Moving Averages (MA) | Trend | Identifies trend direction & reversals via crossovers |
| Relative Strength Index (RSI) | Momentum | Measures speed/change of price movements; overbought/oversold |
| Moving Average Convergence Divergence (MACD) | Momentum/Trend | Shows relationship between two moving averages; trend strength |
| Bollinger Bands | Volatility | Measures market volatility; identifies overbought/oversold levels |
| Stochastic Oscillator | Momentum | Compares closing price to price range; overbought/oversold |
Moving Averages (MA), such as Simple Moving Averages (SMA) and Exponential Moving Averages (EMA), help identify trends and dynamic support and resistance levels. MA crossovers, where a shorter-period MA crosses a longer-period MA, often signal potential trend changes.
The Relative Strength Index (RSI) is a momentum oscillator measuring the speed and change of price movements, indicating overbought or oversold conditions typically above 70 or below 30, respectively.
The Moving Average Convergence Divergence (MACD) indicator reveals the relationship between two moving averages of a security’s price, signaling bullish and bearish trends through its centerline crossovers and signal line crosses.
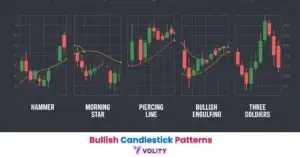
Visual Cues for Future Moves
Chart patterns are specific formations that appear on price charts, providing visual cues for potential future price movements. These patterns, including candlestick patterns, are graphical representations of supply and demand dynamics. Traders use them to identify continuation or reversal signals, often in conjunction with support and resistance levels.
Understanding these visual cues can significantly improve predictive accuracy.
Candlestick patterns, such as Doji, Hammer, and Engulfing patterns, offer insights into market sentiment and potential reversals. For example, a Bullish Engulfing pattern often signals a strong buying interest following a downtrend. Larger chart patterns, like Head and Shoulders, Double Tops/Bottoms, and Triangles, indicate more significant trend reversals or continuations. Price action around support and resistance levels reinforces the validity of these patterns, as these levels often act as psychological barriers where price tends to reverse or consolidate before breaking out.
Ready to Elevate Your Trading?
You have the information. Now, get the platform. Join thousands of successful traders who use Volity for its powerful tools, fast execution, and dedicated support.
Create Your Account in Under 3 MinutesEconomic Forces Driving Currency Prices
Fundamental analysis is a method of predicting forex movements by evaluating economic, financial, and geopolitical factors that influence a country’s currency strength. This approach focuses on the intrinsic value of a currency, believing that market prices will eventually reflect underlying economic realities. It involves assessing a country’s economic health and political stability to forecast currency direction, examining factors like interest rates, inflation, GDP growth, employment figures, and trade balances. The core premise is that a strong, stable economy with favorable interest rates will attract foreign investment, increasing demand for its currency and causing its value to rise.
Major economic news releases, such as interest rate decisions or GDP reports, can cause immediate and significant volatility in currency pairs, often moving prices by 50-100 pips within minutes. This underscores the profound impact of fundamental data.
What factors influence currency prices?
Many factors influence currency prices, primarily stemming from a country’s economic performance and central bank policies. Economic indicators like Gross Domestic Product (GDP), Consumer Price Index (CPI), and employment reports are key drivers. Higher GDP growth and lower unemployment typically signal a strong economy, leading to a stronger currency.
Interest rates, set by central banks, are particularly influential; higher rates attract capital, boosting currency demand. Inflation also plays a critical role, as central banks often raise interest rates to combat rising prices, impacting currency valuations.
How do economic news releases affect forex?
Economic news releases significantly affect forex by providing real-time data that can confirm or contradict market expectations. News trading involves capitalizing on the immediate price reactions to these announcements. High-impact news, such as non-farm payrolls (NFP) in the US, central bank interest rates decisions, or inflation reports, often trigger sharp price movements and increased volatility.
Traders use an economic calendar events to track these scheduled releases, preparing for potential market shifts and adjusting their trading strategy accordingly.
Building a Robust Prediction Strategy
Building a robust prediction strategy in forex often involves combining different analytical approaches to gain a more comprehensive market view. Integrating technical and fundamental analysis, along with an awareness of market sentiment, creates a more resilient trading strategy.
Technical vs. fundamental analysis for forex prediction?
Neither technical nor fundamental analysis is inherently superior for forex prediction; instead, they are complementary. Technical analysis excels at identifying specific entry and exit points and short-term price patterns, while fundamental analysis provides the broader context and long-term direction for currency pairs. A hybrid approach leverages the strengths of both.
Traders often use fundamental analysis to identify which currency pairs to trade and then employ technical analysis to pinpoint optimal trading times.
| Feature | Technical Analysis | Fundamental Analysis |
| Data Focus | Price charts, indicators, volume | Economic reports, news, policies |
| Timeframe | Short to medium-term | Medium to long-term |
| Primary Goal | Identify entry/exit points | Determine intrinsic value, trend |
| Methodology | Pattern recognition, math | Economic theory, interpretation |
| Best For | Timing trades | Directional bias |
How to combine multiple indicators for better predictions?
Combining multiple indicators for better predictions involves looking for confluence, where several indicators provide the same signal, reinforcing a potential move. For example, a trading strategy might combine a Moving Averages (MA) crossover, indicating a trend change, with the RSI indicator showing oversold conditions at a key support level.
This confluence of signals increases the probability of a successful prediction. However, it is crucial not to overload charts with too many indicators, which can lead to analysis paralysis or contradictory signals. Focus on 2-3 reliable indicators that complement each other.
How to backtest a forex prediction strategy?
To backtest a forex prediction strategy, you apply your chosen rules to historical data to see how it would have performed. This process helps validate the strategy’s effectiveness and identifies its strengths and weaknesses before risking real capital.
Backtesting involves setting clear entry and exit points, defining position sizing, and simulating trades over various market conditions. This allows traders to refine their trading strategy, optimize parameters, and build confidence in its predictive capabilities.
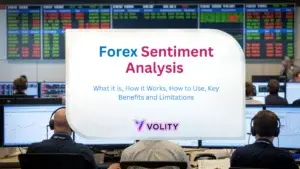
Psychology and Behavioral Economics in Forex
The unseen predictor in forex trading often lies in the realm of psychology and behavioral economics in forex. Human emotions and cognitive biases can significantly impact a trader’s ability to objectively interpret market data and make sound predictions.
Research indicates that emotional biases, such as confirmation bias or overconfidence, significantly impair a trader’s ability to objectively interpret market data and lead to suboptimal prediction outcomes, accounting for up to 40% of trading losses for beginners. Recognizing and managing these psychological factors is as crucial as technical or fundamental analysis.
How Emotions Cloud Prediction Judgement
Emotions like fear, greed, and hope can profoundly cloud a trader’s judgment, leading to irrational decisions and poor prediction outcomes. Fear might cause a trader to exit a profitable trade too early or miss a valid entry, while greed can lead to over-leveraging or holding onto losing trades for too long.
These emotional responses often override logical analysis, preventing traders from objectively applying their trading strategy. Understanding these inherent human tendencies is a critical component of successful trading.
What common mistakes do traders make when predicting?
Common mistakes traders make when predicting movements in the forex market often stem from psychological biases. Confirmation bias causes traders to seek out and interpret information in a way that confirms their existing beliefs, ignoring contradictory evidence. This can lead to rigid predictions, even when market conditions shift.
Overconfidence leads traders to overestimate their predictive abilities, taking on excessive risk or neglecting proper risk management. Other mistakes include chasing the market, revenge trading, and failing to adhere to a predefined trading strategy, all driven by emotional rather than rational decision-making.
Risk Management in Forex Prediction
Even with the most sophisticated prediction methods, the forex market remains inherently unpredictable, making risk management paramount. Effective risk management, including setting stop-loss orders and limiting position size, is cited by professional traders as the single most important factor for long-term survival in forex, often more critical than prediction accuracy.
This emphasizes that surviving market volatility and unexpected moves is more important than always being right. Traders must accept that predictions can fail and prepare for such outcomes.
What are the risks of relying too heavily on predictions?
Relying too heavily on predictions carries significant risks, primarily because no forecast is 100% accurate. Overconfidence in a prediction can lead to excessive position sizing or neglecting stop-loss orders, exposing a trader to substantial losses when the market moves unexpectedly.
The inherent volatility of currency pairs means that unforeseen geopolitical events, sudden economic data shifts, or even large institutional orders can invalidate even the most well-researched predictions. Therefore, a robust risk management framework is essential to mitigate these inherent uncertainties.
How do professionals manage risk when their predictions fail?
Professionals manage risk when their predictions fail by strictly adhering to predefined risk management techniques. This includes using stop-loss orders to automatically close a trade if it moves against their prediction beyond a certain point, limiting potential losses.
They also employ appropriate position sizing, ensuring that only a small percentage of their total capital is at risk on any single trade, typically 1-2%. Furthermore, professionals understand leverage risk, using it judiciously to amplify gains without exposing their entire account to ruin.
This disciplined approach focuses on capital preservation, recognizing that losses are an unavoidable part of trading.
Turn Knowledge into Profit
You've done the reading, now it's time to act. The best way to learn is by doing. Open a free, no-risk demo account and practice your strategy with virtual funds today.
Open a Free Demo AccountAdvanced Prediction Concepts & Tools
Moving beyond foundational technical and fundamental analysis, advanced prediction concepts and tools offer more sophisticated ways to anticipate forex movements. These methods provide a deeper understanding of market dynamics and emerging technologies. They can offer a competitive edge for traders seeking to refine their trading strategy and explore new analytical frontiers.
Connecting the Global Dots
Intermarket analysis examines the relationships and correlations between different financial markets, such as stocks, commodities, bonds, and currencies, to predict movements in currency pairs. For instance, a strong correlation exists between gold prices and the US Dollar, often moving inversely.
Similarly, oil prices can influence the Canadian Dollar (CAD) due to Canada being a major oil exporter. By observing trends and divergences across these interconnected markets, traders can gain predictive insights that are not apparent when analyzing currency charts in isolation. This holistic view helps anticipate broader shifts in global capital flows.
What software or tools are best for forex prediction?
- The best software or tools for forex prediction often combine robust charting capabilities with advanced analytical features, including Neural Networks/AI Prediction.
- Platforms like MetaTrader 4/5, TradingView, and cTrader offer extensive technical analysis tools, customizable indicators, and automated trading functionalities.
- For those interested in Neural Networks/AI Prediction, specialized software and algorithms are emerging that use machine learning to identify complex patterns and make probabilistic forecasts.
- While AI offers immense potential, it currently serves as a supplementary tool, requiring human oversight and integration into a broader trading strategy.
- Many trading platforms are beginning to incorporate AI-driven insights, offering traders more sophisticated analytical capabilities.
BOTTOM LINE
Predicting forex movements is a multifaceted endeavor that demands a comprehensive approach, integrating technical analysis, fundamental analysis, and a keen awareness of market psychology. While no method guarantees 100% accuracy, combining these analytical tools significantly improves the probability of successful forecasts.
Crucially, even the most precise predictions are secondary to robust risk management, which ensures long-term survival in the volatile forex market. By understanding economic drivers, chart patterns, psychological biases, and employing disciplined risk protocols, traders can develop a resilient trading strategy tailored to navigating the complexities of currency pairs.
Key Takeaways
- Combining technical, fundamental, and psychological analysis offers the most comprehensive approach to predicting forex movements.
- Technical analysis uses chart patterns and indicators to identify entry/exit points, while fundamental analysis assesses economic data for directional bias.
- Market psychology and behavioral economics significantly impact trading decisions, requiring self-awareness and emotional management.
- Robust risk management, including stop-loss orders and position sizing, is paramount for long-term survival, even with accurate predictions.
- Advanced tools like intermarket analysis and AI prediction can provide additional insights but require human oversight.