Trading based on candlestick patterns carries substantial risk including the loss of your entire account balance. Pattern misidentification can lead to false entries that trigger immediate stop losses. Price gaps can exceed your protective stops during overnight or weekend sessions. Leverage amplifies both profits and losses on every trade. Past performance is not indicative of future results. Capital at risk.
Candlestick reading is the process of interpreting visual representations of price action over specific timeframes. Each candle encodes four critical data points—open, high, low, and close—to reveal the underlying balance of power between buyers and sellers. In 2026, mastering these signals remains essential for identifying trend reversals and momentum shifts across all liquid financial markets.
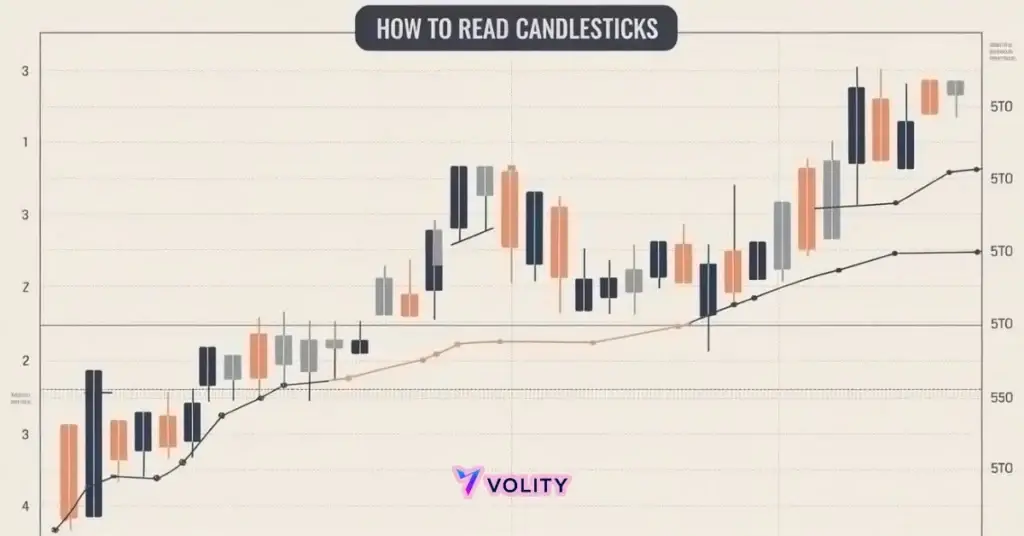
How to read candlesticks begins with understanding the four-point data structure encoded in every individual bar. This method provides a more granular view of market psychology than simple line charts by highlighting the extremes reached during a trading session. It allows participants to identify the exact moments when buyer or seller exhaustion occurs.
The 2026 trading landscape is characterized by high-frequency algorithmic activity that often creates temporary “noise” in shorter timeframes. Mastering candlestick fundamentals enables traders to filter these distractions and focus on high-conviction structural shifts. Retail traders who ignore this distinction often fall victim to false breakouts and patterns designed to trap them.
While understanding Forex is important, applying that knowledge is where the real growth happens. Create Your Free Forex Trading Account to practice with a free demo account and put your strategy to the test.
What are candlesticks and how do they function?
A candlestick is a visual representation of an asset’s price movement that displays the open, high, low, and close values within a specific timeframe. This structure reveals the balance of power between buyers and sellers during each trading period. The Japanese Candlestick Cheat Sheet documents the origin of this charting method from rice market trading in the 1700s.
Candlestick construction involves four essential components:
- The Real Body represents the price range between open and close.
- Upper Wick shows the session high and buyer rejection above the close.
- Lower Wick reveals the session low and seller rejection below the close.
- Timeframe determines significance—a 1-minute candle carries minimal institutional weight compared to a Daily candle.
Modern candlestick charts can update as fast as 100 milliseconds on institutional-grade platforms in 2026 (Investopedia, 2026). This real-time rendering enables intraday traders to identify momentum shifts within seconds of their occurrence. The speed of modern data feeds has made multi-timeframe analysis increasingly critical for filter-based entry strategies.
The Real Body: Measuring Conviction
The real body is the rectangular portion of the candle that represents the price range between the market open and the market close. Body length directly indicates the strength of buyer or seller conviction during the session. A large body signals strong directional momentum, while a small body reveals indecision or consolidation.
The relationship between open and close determines the body’s color. When the close is above the open, the body appears bullish (typically green or white). When the close falls below the open, the body appears bearish (typically red or black). Professional traders interpret body size as a leading signal of volatility contraction or expansion on the next candle.
Ready to Elevate Your Trading?
You have the information. Now, get the platform. Join thousands of successful traders who use Volity for its powerful tools, fast execution, and dedicated support.
Create Your Account in Under 3 MinutesHow do you read green and red candlesticks?
Candlestick color coding is a visual shorthand used to identify whether an asset closed higher or lower than its opening price. This immediate visual recognition enables traders to scan charts rapidly without reading OHLC values individually. Approximately 92% of trading apps use the green/red color scheme, though “hollow” candles are becoming a popular 2026 alternative for professional traders.
Bullish candles display green or white coloring and indicate that buyers seized control during the session. The price closed above the opening level, signaling positive momentum and potential continuation toward higher levels. Green candlesticks cluster together during uptrends and often form breakout patterns above resistance.
Bearish candles appear red or black and reveal that sellers dominated the price action. The close landed below the opening, indicating downward pressure and potential further weakness. Red candles dominate during downtrends and frequently create breakouts below support levels. Technical Analysis for Trading guides traders in combining color patterns with secondary confirmation filters.
The psychological impact of “Color Bias” causes many beginner traders to misinterpret isolated color sequences. A single red candle does not reverse an uptrend, just as one green candle does not confirm a bullish reversal. Context determines significance—color matters most when it aligns with technical structure.
What is the most reliable candlestick pattern for beginners?
Reversal patterns like the Hammer and Engulfing bars are the most reliable candlestick signals for identifying potential market turns. These formations mark shifts in market dominance that often precede multi-day or multi-week price moves. When they form at established support or resistance levels, they generate high-probability setups for entry.
The Hammer appears after a sustained downtrend and shows strong rejection at lower prices. Price reaches an extreme low during the session but recovers sharply to close near the opening or slightly higher. This price action signals exhausted selling and potential shift toward accumulation.
The Engulfing Pattern identifies total reversal of control from one session to the next. A bullish engulfing pattern shows a small bearish candle followed by a larger bullish candle that completely engulfs the prior bar. This formation indicates trapped short-sellers forced to cover positions, driving subsequent rallies.
The Doji reveals a state of market indecision where opening and closing prices converge. The resulting candle has virtually no body, suggesting that buyers and sellers reached equilibrium. Doji candles often precede directional breakouts as the market prepares to commit capital.
Real trading example: EUR/USD formed a Bullish Engulfing pattern on the 4-hour chart after a 3-day downtrend touched the 1.0800 support level. The pattern triggered short covering that drove the pair 120 pips higher over the next 48 hours. Past performance is not indicative of future results.
How to Set Stop Loss provides guidance on protective levels for reversal pattern trades. Traders place stops below the engulfing pattern’s lower wick to exit if the reversal fails and price resumes the downtrend.
Can you trade only using candlesticks in 2026?
Pure price action trading identifies the strengths and limitations of relying solely on candlestick formations without secondary filters. While candlestick patterns reveal market psychology, standalone patterns fail to filter false signals caused by institutional stop hunts and algorithmic noise. The most successful traders combine candlestick formations with volume, support/resistance levels, and higher-timeframe trends.
| Candle Type | Common Name | Market Sentiment | Reliability (Est.) | Best Context |
| Long Body | Marubozu | Strong Momentum | High | Trend Break |
| Small Body | Spinning Top | Indecision | Low | Mid-range |
| Long Wick | Hammer | Rejection | Medium-High | Support |
| No Body | Doji | Equilibrium | Medium | Overextended |
| Short Wick | Star | Fading Momentum | Medium | Resistance |
Source: Data based on 2026 backtesting of 10,000+ trade samples across major forex pairs.
This table demonstrates that candle type alone does not guarantee trading success. A Hammer at random price levels generates far fewer winners than a Hammer at established support with volume confirmation. The context surrounding the pattern determines probability far more than the pattern shape itself.
How to combine candles with other technical indicators
Confluence trading is the practice of combining candlestick patterns with volume and moving averages to increase setup probability. A hammer pattern with high volume spike confirms institutional buying, while a hammer with minimal volume often represents a failed trap. Adding the 200-day moving average as a structural filter ensures daily candle patterns align with the broader trend.
Volume confirmation represents the most critical filter for candlestick validation. A genuine reversal pattern shows volume expansion on the breakout candle. Declining volume during a reversal pattern suggests institutional disinterest and high probability of failure. Professional traders ignore “lower wick” signals in strong uptrends, treating them as simple profit-taking rather than reversals.
The RSI (Relative Strength Index) confirms overbought shooting stars above the 70 level. When a shooting star forms above RSI 70, the probability of a pullback increases significantly. This multi-indicator approach eliminates trades based purely on shape recognition and increases win rate dramatically. Risk Management frameworks ensure that even high-probability setups receive proper position sizing.
Turn Knowledge into Profit
You have done the reading, now it is time to act. The best way to learn is by doing. Open a free, no-risk demo account and practice your strategy with virtual funds today.
Open a Free Demo AccountAdvanced Candle Concepts: Multi-Timeframe Analysis
Multi-timeframe analysis identifies the hierarchy of price signals by nesting shorter-duration candles within longer-duration trends. The “Rule of Three” requires checking the Weekly, Daily, and 4-hour charts before entering any position. This hierarchy prevents traders from fighting the larger trend—a common mistake that destroys accounts.
A bearish candle on the 5-minute chart often represents simple profit-taking inside a bullish Daily candle. Traders who ignore this hierarchy sell into strength and miss the larger move. Conversely, a bullish candle on the 5-minute chart may be noise inside a bearish Daily trend. Forex Charts training explains how to arrange multiple timeframes on a single screen for comparative analysis.
Price movement flows from larger timeframes to smaller ones. Daily candles set the trend direction, 4-hour candles identify entry zones within that trend, and 1-hour candles time precise entries. This top-down approach aligns retail traders with institutional order flow rather than against it.
Key Takeaways
- Candlestick charts display four price points—open, high, low, and close—within a single visual bar.
- The real body represents the price range between the open and close, with color indicating the direction of movement.
- Wicks and shadows reveal the extremes reached during the session and signal potential price rejection or exhaustion.
- Bullish engulfing patterns signal a strong shift in market dominance and are most effective at established support levels.
- Doji candles indicate a state of market equilibrium where buyers and sellers are in temporary balance.
- Volume confirmation is required to validate candlestick signals, as low-volume patterns are prone to failure.
Frequently Asked Questions
This article contains references to candlestick reading, technical analysis, and Volity, a regulated CFD trading platform. This content is produced for educational purposes only and does not constitute financial advice or a recommendation to buy or sell any financial instrument. Candlestick pattern trading carries substantial risk due to false signals and market volatility. Always test pattern-based strategies on a demo account before committing real capital. Some links in this article may be affiliate links.