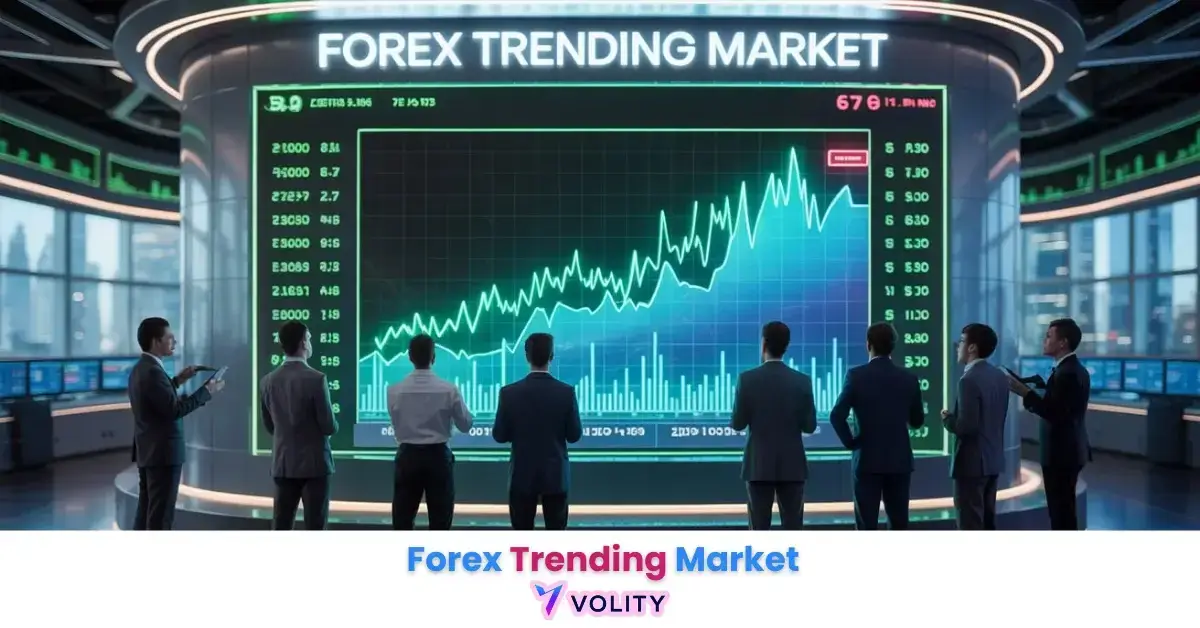
The Forex market never runs the same. It can be volatile and unpredictable, sometimes moving in sideways patterns, and other times, it’s even trending strongly in one direction. Well, you must understand that trending markets can present great opportunities for profit. But only if you know how to capitalize on them. It’s all a game of timing, strategy, and momentum.
This guide will help you understand how to recognize trends, choose the right strategies, and use powerful tools to navigate the upword or downward movements with confidence and precision.
Key Takeaways
- A trending market moves consistently in one direction, either forming higher highs and higher lows in an uptrend or lower highs and lower lows in a downtrend.
- Long-term trends last months or years, requiring trend-following strategies, while short-term trends last minutes to weeks and are suited for faster, more reactive strategies.
- Economic data, geopolitical events, market sentiment, monetary policies, and global trade influence the direction of Forex trends.
- Trending markets move in one direction, while ranging markets move sideways between support and resistance levels.
- Price action, moving averages, MACD, ADX, and RSI are key indicators for identifying and confirming trends.
- Momentum drives the trend, with strong momentum indicating sustained movement, while weak momentum can signal a reversal or slowdown.
What is a Trending Market in Forex?
A trending market is best defined as a Forex market where prices move consistently in one direction. Yes, it could be an:
- Uptrend in which prices form higher highs and higher lows
- Downtrend in which prices form lower highs and lower lows.
The market moves with momentum, showing a clear directional flow without significant reversals or sideways movement.
Confusing? Let’s simplify it.
Suppose that you are watching the EUR/USD currency pair. In an uptrend, the price starts at 1.1000, moves up to 1.1050 (higher high), then pulls back slightly to 1.1020 (higher low), and continues upward to 1.1100 (higher high). The price is consistently making higher highs and higher lows, indicating an uptrend.
In a downtrend, the price starts at 1.2000, drops to 1.1950 (lower low), then moves slightly higher to 1.1980 (lower high), and drops again to 1.1900 (lower low). The price is consistently making lower highs and lower lows, indicating a downtrend.
See, that’s how a trending market works. It gives you a clear direction to find opportunities that can help you make profits.
The Difference Between Long-Term and Short-Term Trends in Forex
There are two types of trends in Forex: long-term trends and short-term trends. Each requires a different approach.
You need to understand the difference between long and short term trends. Only then you can choose the right strategy, manage risk effectively, and optimize your trading performance.
Long-term trends last from months to years and are driven by fundamental factors, offering higher potential rewards but also higher risks. On the other hand, short-term trends last from minutes to weeks, are more volatile, and require faster decision-making with a focus on technical analysis.
| Aspect | Long-Term Trend | Short-Term Trend |
| Duration | Several months to years | Minutes to weeks |
| Market Reaction | Typically less volatile with smoother price movements | More volatile with frequent fluctuations and pullbacks |
| Risk & Reward | Higher reward potential but higher risk due to extended duration | Lower reward potential but also lower risk due to shorter time frame |
| Trading Strategy | Trend-following strategies, such as position trading | Scalping, day trading, or swing trading strategies |
| Indicators Used | 200-day moving averages, ADX, fundamental analysis | 10-50 day moving averages, RSI, MACD, Bollinger Bands |
Factors That Drive Forex Market Trends
Now, it is important to understand which factors help determine the direction of the market, whether it’s trending up or down.
- Economic Data: Reports such as GDP, inflation, employment, and interest rates play a major role. Positive economic data can trigger a bullish trend, while negative data can lead to a bearish trend.
- Geopolitical Events: Political instability, wars, elections, or trade tensions can create uncertainty, pushing prices in one direction. Major political events often lead to significant trends in the Forex market.
- Market Sentiment: Trader psychology and market sentiment play a key role. For instance, as traders feel optimistic about an economy, they tend to buy, which leads to an uptrend. On the other hand, fear or uncertainty can drive sell-offs, which creates a downtrend. This is why mastering predicting market trends becomes essential for timing entries and avoiding false moves.
- Monetary Policy: Actions taken by central banks, such as interest rate changes or quantitative easing, can influence trends. For instance, higher interest rates typically attract investors, fueling currencies through carry trade in trends, which often supports long-lasting bullish moves.
- Global Trade and Capital Flows: Shifts in global trade balances and capital movement between countries can drive trends. For instance, a surge in exports can strengthen a nation’s currency, which leads to an uptrend.
Ready to Elevate Your Trading?
You have the information. Now, get the platform. Join thousands of successful traders who use Volity for its powerful tools, fast execution, and dedicated support.
Create Your Account in Under 3 MinutesTrending Market VS Ranging Market
Now, before you jump into trading, it’s important to understand that there are two main market conditions: Trending Markets and Ranging Markets.
A Trending Market shows a consistent price movement in one direction, driven by strong momentum, which offers higher potential rewards but with increased risk. On the other hand, a Ranging Market lacks a clear direction, with price fluctuating between support and resistance levels, which presents a lower risk and reward.
You must fully grasp the difference between trending and ranging markets, so you can appropriately choose the right trading strategy and manage risks effectively.
| Criteria | Trending Market | Ranging Market | Risk Level | Reward Potential |
| Price Direction | Moves consistently in one direction (up or down) | Moves sideways between support and resistance levels | Higher | Higher |
| Momentum | Strong momentum pushing price in one direction | Low momentum, fluctuates within range | Higher | Lower |
| Risk and Reward | Higher risk with higher potential reward due to strong directional movement | Lower risk, but lower reward potential due to limited price movement | High | Low |
| Trading Strategy | Trend-following strategies (e.g., breakout, pullback) | Range-bound strategies (e.g., buy at support, sell at resistance) | Trend-following | Range-bound strategies |
| Market Behavior | Sustained directional movement with minimal reversals | Consolidation, fluctuates back and forth between support and resistance | Higher | Lower |
How to Identify a Trending Market Using Indicators and Tools?
Alright, so you’ve decided to get serious about trading, and one of the first things you need to understand is how to spot a trending market. You want to know if the market is moving in one direction, whether up or down, because that’s where the real opportunities are. You don’t want to waste time trying to trade sideways markets with no clear movement. So, let’s break it down.
Step 1: Look at the Price Action If It Is Moving Up or Down
Let’s start with the most basic tool—price action. You don’t always need fancy indicators to get a feel for the market. Just take a step back and look at the chart. In an uptrend, you’ll notice higher highs and higher lows. Picture it like climbing a staircase—each step (or price point) is higher than the last. You could be looking at a chart where prices keep making new peaks.
For example, imagine EUR/USD starts at 1.1000, moves up to 1.1050, pulls back to 1.1020, and then jumps again to 1.1100. The price is consistently climbing, and that’s a clear uptrend.
In contrast, a downtrend shows lower highs and lower lows. So, the price starts at 1.2000, drops to 1.1950, pulls back a bit to 1.1980, and then falls again to 1.1900. If the price keeps dropping like that, it’s a downtrend.
Step 2: Confirm the Trend with Moving Averages
But just looking at price action alone might not be enough. To make sure you’re not missing something, let’s bring in some tools. The first one to look at is a Moving Average (MA).
Suppose you’re looking at the 50-period Simple Moving Average (SMA). If the price is consistently above the moving average, it’s a strong sign that you’re in an uptrend. It’s like a guiding line that shows the general direction of the market.
You can surely see it as the path ahead on your journey. If the price stays above the line, the road is still climbing. If the price drops below the moving average, you might be entering a downtrend. See, such a simple line can help you stay on track with the trend and avoid getting caught in a reversal.
Step 3: Use the MACD to Confirm Momentum
Okay, so you have spotted a trend, but what about momentum? This is exactly why you need the Moving Average Convergence Divergence indicator. The MACD helps you measure momentum. In simple terms, it tells you how strong the trend is.
Let’s say you’re watching EUR/USD again. If the MACD line crosses above the signal line, that’s a sign that the market is gaining strength in an uptrend. If it crosses below, that’s a downtrend signal.
Basically, MACD crosses above the signal line while EUR/USD is making higher highs. This combination tells you that not only is the trend moving up, but it’s also picking up speed. The price is gaining momentum, and you can confidently trade in that direction.
Step 4: Check the ADX for Trend Strength
Now, momentum is important, but you also need to know how strong that trend is. That’s where the ADX (Average Directional Index) comes into play. It measures the strength of the trend, not the direction.
If the ADX is above 25, it indicates a strong trend. Below 20, it’s a sign of a weak or no trend. Let’s say the ADX rises above 25, and the +DI (Positive Directional Indicator) is above the -DI (Negative Directional Indicator). This signals a strong bullish trend.
But if the ADX is above 25, and the -DI is higher than the +DI, you’re looking at a strong bearish trend. It’s like confirming whether your boat is sailing smoothly with the wind at your back, or if you’re fighting against strong currents.
Step 5: Use Bollinger Bands to Spot Continuation or Reversal
Alright, you’ve got the direction and momentum down, but sometimes, trends slow down and consolidate before continuing. Bollinger Bands can help you spot when that happens.
Let’s say the price is moving in an uptrend, and it starts to hug the upper band. This suggests the price is moving strongly with the trend. If it stays there, it’s a good signal that the trend will continue.
On the other hand, if the price hits the lower Bollinger Band and starts to reverse, you might be seeing a trend reversal or a slowdown. Think of it like a pullback—the trend is taking a breather before pushing forward again.
Traders often add the parabolic SAR trend indicator to spot potential continuation or reversal points. Its dotted signals above or below price action provide a simple yet effective way to confirm whether the trend is still intact or losing steam.
Step 6: Use RSI to Check If the Market Is Overbought or Oversold?
Finally, let’s talk about RSI (Relative Strength Index). This indicator measures the speed and change of price movements. It oscillates between 0 and 100, showing you when the market is overbought or oversold.
- Above 70: The market might be overbought, signaling that the uptrend could be exhausted.
- Below 30: The market might be oversold, signaling that the downtrend could be nearing its end.
If the RSI stays above 50 and rises, you’re in a strong uptrend. If it stays below 50 and drops, you’re in a downtrend. It’s like a pulse check on the trend, which helps you gauge when the market is too hot (overbought) or too cold (oversold).
What is Momentum in the Trending Market?
Momentum refers to the strength behind a price movement in a specific direction. Basically, in a trending market, momentum is the force that propels the price either upwards or downwards.
- Strong momentum means the trend is moving with energy and speed, allowing the price to keep moving in the same direction.
- Weak momentum, on the other hand, indicates that the trend might lose steam, which leads to reversals or a slowdown.
Let’s understand it through an example.
Suppose you’re watching the EUR/USD currency pair. The price starts at 1.1000, rises to 1.1050, pulls back to 1.1020, and then climbs again to 1.1100. You notice that the price consistently forms higher highs and higher lows, which indicates the market is in an uptrend.
So, as the price continues to rise, you see the following, which confirms a strong momentum:
- RSI is above 50 and increasing
- MACD crosses above its signal line
- ADX is above 25
Now it is clear that here the market has strong upward momentum driving the price higher. Or shall we say that the trend is being fueled by momentum, and the price is likely to continue in the same direction.
Turn Knowledge into Profit
You've done the reading, now it's time to act. The best way to learn is by doing. Open a free, no-risk demo account and practice your strategy with virtual funds today.
Open a Free Demo AccountFinal Words
Now, if you want to trade in the trending market, you need to be sure of the right strategy and how to apply it effectively:
- Trend Following Strategy is ideal when the market shows a clear and consistent direction.
- Breakout Strategy is best when the price breaks through key support or resistance levels.
- Pullback Strategy works well when the market retraces within an established trend.
- Moving Average Crossover Strategy is ideal when a short-term moving average crosses a long-term moving average.
- RSI Overbought/Oversold Strategy is best when RSI indicates overbought or oversold conditions.
The right strategy will depend on whether the trend is long-term or short-term. In fact, you will also need to understand trend timing to maximize your chances of success. For instance, it is evident that long-term trends require patience and a focus on trend-following strategies, while short-term trends demand quicker, more reactive approaches like breakouts and pullbacks.