Kurze Antwort
Korrekturwellen sind die Gegentrendbewegungen der Elliott-Wellen-Theorie, die den Preis gegen den Haupttrend zurückziehen, mit A-B-C bezeichnet. Sie folgen den fünfteiligen Impulswellen und nehmen oft Formen wie Zickzacks, Flats oder Dreiecke an. Trader nutzen Korrekturwellenmuster, um zu antizipieren, wo ein Rücksetzer enden und der Trend wieder einsetzen könnte, obwohl sie notorisch schwer zu lesen sind.
Die Elliott-Wellen-Analyse ist subjektiv und hängt von einer präzisen Wellenzählung ab. Eine korrigierende Welle fälschlicherweise als Trendumkehr zu identifizieren, kann zu erheblichen finanziellen Verlusten führen.
Wellenstrukturen in volatilen Märkten wie Krypto weisen oft ausgedehnte Unterwellen auf, die traditionelle Fibonacci-Normen umgehen. Die Wertentwicklung in der Vergangenheit ist kein Indikator für zukünftige Ergebnisse.
Kapital ist gefährdet.
Korrekturwellen identifizieren die wesentlichen „Atemphasen“ eines Markttrends, in denen der Preis vorübergehend korrigiert oder sich seitwärts bewegt, um frühere Gewinne zu verarbeiten. Diese Strukturen zeigen eine Wahrscheinlichkeit von 65 % für eine Trendfortsetzung, sobald die Drei-Wellen-Sequenz (A-B-C) nachweislich abgeschlossen ist. Indem sie die von Ralph Nelson Elliott entwickelten fraktalen Regeln befolgen, können Trader zwischen einem geringfügigen Rücksetzer und einer signifikanten strukturellen Umkehr unterscheiden.
Die technische Landschaft des Jahres 2026 ist geprägt vom institutionellen Einsatz Fibonacci-basierter Algorithmen, die auf präzise Korrekturtiefen wie 38,2 % und 61,8 % abzielen. Während die Märkte durch die komplexe W-X-Y-X-Z-Struktur des Grand Supercycle navigieren, ist das Verständnis der internen Unterwellenzählungen von Korrekturen die wichtigste Fähigkeit für das Risikomanagement. Dieser Leitfaden identifiziert die primären Arten von Korrekturwellen und enthüllt die Benchmarks für 2026 für eine erfolgreiche Wellenzählung.
Das Verständnis von Korrekturwellen ist wichtig, doch echtes Wachstum entsteht erst durch die Anwendung dieses Wissens. Kostenloses Forex-Handelskonto erstellen, um mit einem kostenlosen Demokonto zu üben und Ihre Strategie zu testen.
Was sind Korrekturwellen und wie viele Wellen enthält ein Muster?
Korrekturwellen sind Drei-Wellen-Preisstrukturen, die eine vorübergehende Unterbrechung des vorherrschenden Trends identifizieren und typischerweise aus den Wellen A, B und C bestehen. Die gegenläufige Aktion zeigt, warum Korrekturen sich gegen das Primärmomentum der Welle höheren Grades bewegen. Die 3-Wellen-Regel identifiziert interne Unterwellen als Zickzack (5-3-5-Struktur) oder Flats (3-3-5-Struktur). Die Stimmungsverschiebung zeigt, dass Korrekturen nicht die Überzeugung impulsiver Wellen besitzen und die Zögerlichkeit der Marktteilnehmer demonstrieren.
Die Terminologie unterscheidet zwischen „scharfen“ Korrekturen (Zickzack), die sich aggressiv gegen den Trend bewegen, und „seitwärts“ verlaufenden Korrekturen (Flats/Dreiecke), die den Preis horizontal konsolidieren. Standard-A-B-C-Korrekturen haben eine historische Wahrscheinlichkeit von 65 % für eine Trendfortsetzung, wenn die internen Unterwellenzählungen gültig bleiben. (Quelle: Elliott Wave Forecast, 2026) Elliott-Wellen-Theorie: Regeln & Muster bietet grundlegendes Training zur Wellenstruktur.
Bereit, Ihr Trading auf das nächste Level zu bringen?
Sie haben das Wissen. Jetzt fehlt die Plattform. Schließen Sie sich Tausenden erfolgreichen Tradern an, die Volity für leistungsstarke Tools, schnelle Ausführung und engagierten Support nutzen.
Erstellen Sie Ihr Konto in unter 3 MinutenZickzack, Flats und Dreiecke: Identifizierung der Kern-Korrekturtypen
Die primären Arten von Korrekturwellen identifizieren sich als Zickzack, Flats und Dreiecke, wobei jedes einen unterschiedlichen psychologischen Zustand der Marktteilnehmer offenbart. Zickzack (5-3-5) erzeugt scharfe, aggressive Korrekturen, die oft 50 % bis 61,8 % des vorherigen Impulses korrigieren und maximalen Verkaufsdruck offenbaren. Flats (3-3-5) repräsentieren eine Seitwärtskonsolidierung, bei der Welle B oft den Beginn von Welle A erreicht oder überschreitet, was ein ausgeglichenes Kauf- und Verkaufsverhalten zeigt.
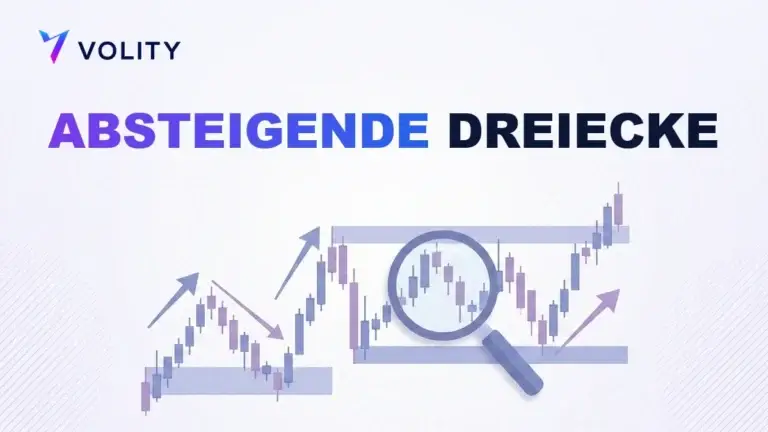
Dreiecke (3-3-3-3-3) identifizieren sich verengende Strukturen, die am häufigsten in Welle-4-Positionen auftreten. Die 2026-Variante „Running Flat“ zeigt einen so starken Markt, dass die Korrektur kaum zurücksetzt, was auf institutionelle Akkumulation während der Rücksetzer hindeutet. Forex-Marktstruktur: Wie man Verschiebungen erkennt erklärt, wie diese Muster strukturelle Veränderungen signalisieren.
Wie identifiziert man 2026 Korrekturwellen mithilfe von Fibonacci-Retracements?
Fibonacci-Retracements identifizieren die mathematischen Endpunkte von Korrekturwellen, wobei die 38,2 %- und 61,8 %-Marken die signifikantesten Zonen für die Trendwiederaufnahme im Jahr 2026 aufzeigen. Welle-2-Normen zeigen, dass professionelle Analysten 50 % bis 61,8 % als Ziele für die erste große Korrektur identifizieren. Welle-4-Normen zeigen 38,2 % als primäre „Nachladezone“ für institutionelle Algorithmen im S&P 500 des Jahres 2026.
Die Alternationsregel erklärt, dass, wenn Welle 2 scharf war, Welle 4 als komplexe, flache Seitwärtsbewegung erwartet wird. Zielprojektionen verwenden Fibonacci-Extensions, um die potenzielle Länge von Welle C zu berechnen. Fibonacci-Retracement im Forex: Was ist FIB? enthüllt Berechnungsmethoden.
2026 Wellenanalyse-Benchmarks und EAV-Tabelle
Elliott-Wellen-Benchmarks enthüllen die Retracement-Normen und Musterhäufigkeiten, die 2026 auf den globalen Aktien- und Forex-Märkten beobachtet wurden.
| Mustertyp | Interne Struktur | 2026 Retracement-Norm |
| Zickzack | 5-3-5 | 50 % – 61,8 % (Tief) |
| Reguläres Flat | 3-3-5 | 90 % – 105 % (Flach) |
| Welle 4 (S&P) | Variabel | 38,2 % (Benchmark) |
| Dreieck | 3-3-3-3-3 | 0 % – 23,6 % (Seitwärts) |
| ABC Erfolg | Trendwiederaufnahme | 65 % Wahrscheinlichkeit |
Daten stammen aus dem Elliott Wave Forecast 2026 und technischen Berichten von Vantage Markets. Der Zugriff auf Vantage Markets: Fibonacci-Retracement-Level für Welle 4 bestätigt die aktuellen Benchmarks.
Wissen in Gewinn verwandeln
Sie haben gelesen, jetzt ist es Zeit zu handeln. Der beste Weg zu lernen ist durch Praxis. Eröffnen Sie ein kostenloses, risikofreies Demokonto und üben Sie Ihre Strategie noch heute mit virtuellem Guthaben.
Kostenloses Demokonto eröffnenDie „Komplexitätsregel“: Warum Korrekturen Liquidität suchen
Die Komplexität von Korrekturwellen identifiziert sich als passive Preissuche nach Liquidität, bei der Marktteilnehmer darauf „warten“, dass sich genügend Aufträge ansammeln, bevor der aggressive Impuls wieder aufgenommen wird. Passive gegenüber aggressiver Aktion zeigt, dass Korrekturen nicht das „vertikale“ Momentum von Impulswellen besitzen. W-X-Y-Muster identifizieren das „Double Three“, das zwei einfache Muster zu einer längeren Konsolidierung verbindet.
Die 11-Swing-Struktur erklärt, wie komplexe WXYXZ-Strukturen längere Phasen der Unentschlossenheit identifizieren. Liquiditätstaschen werden nachweislich „gefüllt“, da Korrekturen die Lücken absorbieren, die durch schnelle Welle-3-Preissprünge hinterlassen wurden.
Forex-Liquidität: Wie man Kosten kontrolliert untersucht die Mechanismen der Preisverfügbarkeit.
Häufige Fehler: Korrekturen mit neuen Trends verwechseln
Die häufigsten Fehler in der Wellenanalyse identifizieren sich als falsche Kennzeichnung einer komplexen Korrektur als neue Trendumkehr, was nachweislich zu einem vorzeitigen Einstieg gegen das Makro-Momentum führt. Überlappende Wellen zeigen, dass Welle 4, die Welle 1 überlappt, einen ungültigen Impuls identifiziert (es sei denn, es handelt sich um eine Diagonale). Die RSI-Bestätigung verwendet bullische/bärische Divergenz, um zu identifizieren, wann eine Korrektur ihre Unterwellen nachweislich erschöpft hat.
Das Erzwingen der Zählung führt dazu, dass Trader die obligatorische „5-Wellen“-Bewegung aus einer Korrektur heraus überspringen, bevor sie den Trend als wiederaufgenommen identifizieren. Regelverstöße zeigen, dass Welle B in einem Zickzack nicht mehr als 100 % von Welle A korrigieren kann. Ein echtes Beispiel: Ein Trader identifizierte einen scharfen EUR/USD-Abfall als „Umkehr“, aber es war tatsächlich ein Zickzack-Welle-A einer größeren Korrektur. Der Trader stieg am Tiefpunkt von Welle A short ein; Welle B korrigierte um 61,8 % und löste den Stop-Loss aus, bevor Welle C endete. Die Wertentwicklung in der Vergangenheit ist kein Indikator für zukünftige Ergebnisse.
Was ist eine Umkehr im Trading? unterscheidet vorübergehende Rücksetzer von strukturellen Umkehrungen. Der Zugriff auf Elliott Wave International: Offizielle Regeln für Korrekturmuster bestätigt die offizielle Anleitung.
Wichtige Erkenntnisse
- Korrekturwellen identifizieren die gegenläufigen Phasen eines Marktzyklus, die typischerweise einer Drei-Wellen-Struktur (A-B-C) folgen.
- Fibonacci-Retracement-Level zeigen, dass Welle 2 typischerweise 50 % – 61,8 % erreicht, während Welle 4 im Jahr 2026 üblicherweise die 38,2 %-Benchmark anvisiert.
- Zickzack-Muster werden als scharfe Korrekturmuster mit einer 5-3-5-Struktur identifiziert, während Flats eine Seitwärtsbewegung mit einer 3-3-5-Zählung offenbaren.
- Korrekturwellen dienen als „passive“ Suche nach Liquidität und ermöglichen es den Märkten, das Volumen anzusammeln, das für die nächste Impulsphase benötigt wird.
- Die erfolgreiche Identifizierung einer 3-Wellen-Korrektur offenbart eine Wahrscheinlichkeit von 65 %, dass der Primärtrend wieder aufgenommen wird, sobald das Muster abgeschlossen ist.
- Die Verwechslung einer komplexen Korrektur mit einer Trendumkehr identifiziert die häufigste Ursache für Stop-Loss-Auslösungen bei fortgeschrittenen Wellenanalysten.
Häufig gestellte Fragen
Dieser Artikel enthält Verweise auf die Elliott-Wellen-Theorie, technische Analysemuster und Marktstrukturanalyse und erwähnt Volity, eine regulierte CFD-Handelsplattform. Dieser Inhalt wurde nur zu Bildungszwecken erstellt und stellt keine Finanzberatung oder Handelsempfehlung dar.
Die Wellenanalyse hängt von subjektiven Wellenzählungen und historischen Mustern ab, die das zukünftige Marktverhalten möglicherweise nicht vorhersagen. Führen Sie immer unabhängige Recherchen durch und nutzen Sie ein Risikomanagement, bevor Sie handeln.
Einige Links in diesem Artikel können Affiliate-Links sein.
Was unsere Analysten beobachten: Korrekturwellen sind der Bereich, in dem die meisten Elliott-Zählungen scheitern, da die Muster von Natur aus variabler sind als Impulse. Drei Unterscheidungsmerkmale tragen den größten Teil des praktischen Gewichts.
Interne Wellenzählung des Korrekturbeins (ein sauberes 5-3-5 bestätigt ein Zickzack; ein 3-3-5 bestätigt ein Flat; eine falsche Kennzeichnung hier entwertet die breitere Zählung). Fibonacci-Retracement-Level (Korrekturen, die 78,6 Prozent des vorherigen Impulses überschreiten, entwerten normalerweise die Wellenzählung und signalisieren einen Regimewechsel statt einer Fortsetzung).
Zeitsymmetrie zwischen dem vorherigen Impuls und der aktuellen Korrektur (Korrekturen, die in wesentlich kürzerer Zeit als der Impuls abschließen, sind oft unvollständig und neigen zur Ausdehnung). Die institutionellen Elliott-Desks behandeln die Korrekturwellenanalyse als Wahrscheinlichkeitsrahmen, nicht als deterministische Prognose: Zählen Sie die Struktur, setzen Sie Ungültigkeitsniveaus bei klar definierten Fibonacci-Breakpoints und dimensionieren Sie Positionen so, dass eine falsche Zählung nicht mehr als eine Risikoeinheit kostet.
Der Rahmen belohnt Disziplin und bestraft Übermut.
Volity betreibt eine Handelsplattform und veröffentlicht außerdem Bildungs- und Analyseinhalte zum Thema Trading. Die Inhalte dieser Seite dienen ausschließlich Bildungszwecken und sind nicht als Finanzberatung zu verstehen. Volity kann kommerziell profitieren, wenn Leser über Links auf dieser Website Handelskonten eröffnen.
Unsere Inhalte werden nach dokumentierten redaktionellen Standards erstellt und geprüft; siehe unsere Vergleichs- und Bewertungsmethodik.