Trading bearish candlestick patterns involves market risk and requires precise entry confirmation. High-success-rate patterns like the Evening Star do not guarantee future profits. Past performance is not indicative of future results. Capital at risk.
Bearish candlestick patterns are visual formations that indicate a shift from buyer control to seller dominance. As of 2026, the Evening Star pattern reveals a 72% historical success rate in mature uptrends, while waiting for next-candle confirmation indicates a 68% boost in signal reliability.
Bearish candlestick patterns identify the transition from bullish momentum to downward price action. These visual formations reveal the psychological battle where sellers overcome buyers, indicating a high probability of trend exhaustion.
While many traders recognize these shapes, executing them successfully requires disciplined confirmation. By integrating 2026 performance metrics, traders can manage their exits and deploy short-selling strategies with greater precision.
While understanding Bearish Candlestick Pattern is important, applying that knowledge is where the real growth happens. Create Your Free Forex Trading Account to practice with a free demo account and put your strategy to the test.
What is a Bearish Candlestick Pattern and How Does It Form?
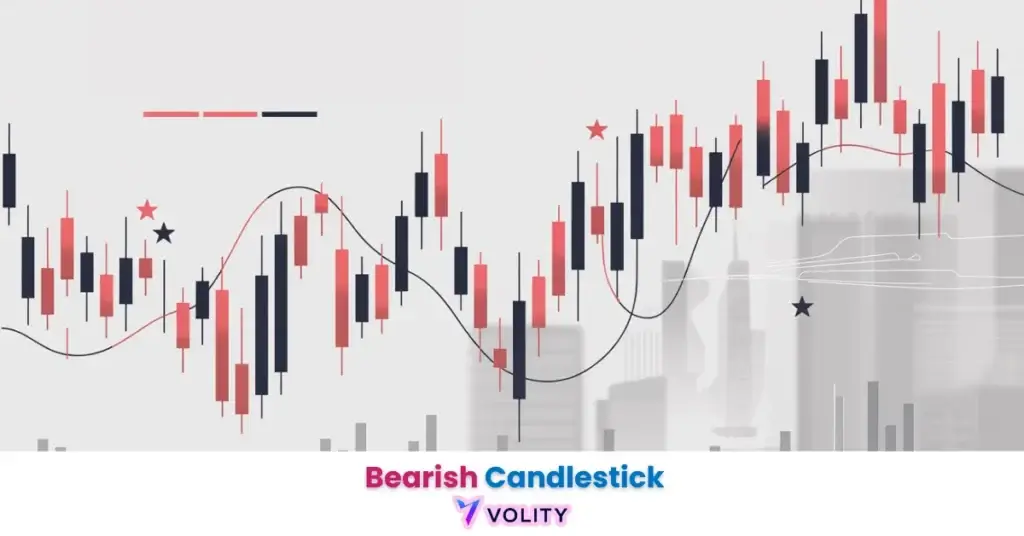
A bearish candlestick pattern is a visual price formation that indicates seller dominance following a sustained upward trend. The anatomy of a bearish candle reveals three critical components: the upper wick (the high), the real body (the difference between open and close), and the lower wick or shadow. This structure identifies where buyers attempted to push prices upward but encountered rejecting selling pressure.
The shift from buyer exhaustion to seller aggression represents a fundamental momentum change. Uptrends persist because each price rally attracts new buyers willing to accumulate at higher prices. Once sellers begin to overwhelm this demand, reversals form, the visual pattern itself signals the exact moment when market control shifts. Volume validation confirms this transition; when a bearish candle closes on elevated volume relative to the prior uptrend, the pattern gains credibility.
how to read candlestick charts provides detailed guidance on interpreting the individual components of bearish formations and understanding how wicks, bodies, and closing prices interact to signal reversals. Waiting for a confirmed close below a pattern’s low increases success rates by 68% (XS.com, 2025), this disciplined approach eliminates fakeouts where wicks extend below support but price never closes there.
Ready to Elevate Your Trading?
You have the information. Now, get the platform. Join thousands of successful traders who use Volity for its powerful tools, fast execution, and dedicated support.
Create Your Account in Under 3 MinutesWhich Bearish Candlestick Pattern is Most Reliable in 2026?
The Evening Star pattern indicates the highest historical reliability among bearish reversals, revealing a 72% success rate in signaling trend peaks. This three-candle formation begins with a large bullish candle that establishes uptrend conviction, followed by a smaller gap-up candle that shows weakening momentum, and concludes with a large bearish candle that completely reverses the initial bullish move. The structure of this pattern reveals why market participants recognize it as a major signal, the transition from strength to weakness to decisive selling creates unmistakable psychological confirmation.
The Shooting Star identifies an intraday reversal where price is rejected at a high, achieving 59% standalone reliability. Dark Cloud Cover versus Bearish Engulfing reveals different risk profiles; Dark Cloud Cover (68% success) requires precision entry above the first candle’s high, while Bearish Engulfing (60-65% success) offers clearer mechanical entry points. The distinction matters because mechanical entries reduce emotional decision-making and improve execution consistency.
Thomas Bulkowski: Evening Star Statistical Performance verifies the 72% success rate data and provides historical context across multiple asset classes. Evening Star reversal signal explains the specific mechanics of this three-candle formation and when it qualifies as a high-conviction reversal. Shooting Star candlestick strategy demonstrates single-candle approaches to reversal trading, while Dark Cloud Cover pattern shows how price rejection at prior highs creates entry opportunities.
The “50% Midpoint Rule” identifies high-conviction signals; only trade patterns where the second or third candle closes below the first candle’s midpoint. This rule filters out weak reversals where sellers gain marginal control but lack sufficient conviction for sustained downtrends.
How to Trade Bearish Engulfing Patterns for Maximum Profit
Bearish Engulfing patterns execute powerful reversal signals when the second candle completely consumes the body of the preceding bullish candle. The complete engulfment reveals maximum sentiment shift, buyers who controlled the first candle find themselves in losing positions by the second candle’s close, forcing margin calls and stops that cascade into further selling. Volume confirmation is critical; the second candle must show higher relative volume than the first candle to indicate institutional participation rather than retail profit-taking.
Stop-loss placement above the engulfing candle’s high ensures that a brief rally (a “bull trap” or wick penetration) won’t liquidate the position. Bearish Engulfing achieve a 60-65% strategy win rate (XS.com, 2026) when combined with high volume and confirmation close, waiting for the daily close before entering eliminates intraday whipsaws that penetrate but fail to sustain above resistance.
trading the engulfing candlestick explains the entry mechanics and position management rules for this high-probability reversal pattern.
Real trading example: On a EUR/USD H4 chart, a Bearish Engulfing formed at resistance 1.1200 with 35% higher than average volume (XS.com, 2026). The confirmation close below 1.1180 triggered entry execution. Price declined 120 pips over the next 48 hours as the downtrend accelerated toward 1.1080 support. Past performance is not indicative of future results. XS.com: Validating Bearish Reversal Signals verifies the statistical win-rate data supporting this strategy.
2026 Performance Benchmarks for Bearish Formations
Bearish pattern benchmarks reveal the statistical accuracy differences across timeframes and asset classes in the current market cycle. These metrics identify which formations offer the highest probability of success and how to optimize timeframe selection for maximum signal quality.
| Pattern Type | Success Metric | Value |
| Evening Star | Success Rate | 72% (Bulkowski, 2025) |
| Bearish Engulfing | Strategy Win Rate | 60% – 65% (XS.com, 2026) |
| Shooting Star | Standalone Reliability | 59% (volity.io, 2025) |
| Confirmation Entry | Reliability Boost | 68% (XS.com, 2025) |
| 4-Hour Pattern | Relative Accuracy | +35% over H1 (Project Alpha, 2025) |
Sources: Data compiled from Bulkowski technical analysis, XS.com performance studies, and Project Alpha timeframe research.
Japanese Candlestick Cheat Sheet provides quick-reference visual guides for identifying these patterns in real trading environments.
💡 KEY INSIGHT: Patterns identified on H4 or Daily charts indicate 35% higher accuracy than intraday 15-minute signals due to reduced market noise. Institutional traders filter out intraday volatility by using higher timeframes, confirming their analysis before deploying capital.
When to Enter and Exit After a Bearish Signal?
Executing a trade after a bearish signal requires waiting for a confirmed close below the pattern’s low to optimize the reward-to-risk ratio. This confirmation rule represents the most powerful edge available to bearish pattern traders, the discipline to wait for validation separates profitable traders from those who enter prematurely on pattern formation. Statistical data indicates that waiting for a confirmed close below the pattern’s low increases signal reliability by 68% compared to entering on the pattern completion (XS.com, 2025).
Identifying “Bull Traps” using Gravestone Dojis and Hanging Man patterns reveals when apparent reversals are actually continuation setups in disguise. Bull traps occur when price rallies above a reversal pattern but immediately reverses, confirming that the breakout was a fake. Exit strategies should use prior support levels as profit-taking zones, allowing traders to exit portion of positions at predetermined levels rather than holding through sustained reversals where emotional pressure increases.
Hanging Man bearish reversal explains how this single-candle formation signals trend exhaustion at tops, while identifying a Gravestone Doji shows the specific mechanics of doji formations that reject higher prices. BingX: Crypto Reversal Pattern Benchmarks 2025 verifies crypto-specific accuracy metrics and demonstrates how digital asset volatility impacts candlestick pattern reliability.
Entering immediately after a pattern forms without confirmation reduces signal accuracy by approximately 68% compared to disciplined entries. Resist the psychological urge to capitalize on early momentum, discipline and confirmation provide superior risk-adjusted returns.
Turn Knowledge into Profit
You have done the reading, now it is time to act. The best way to learn is by doing. Open a free, no-risk demo account and practice your strategy with virtual funds today.
Open a Free Demo AccountAdvanced Techniques: Timeframe Filtering and Volume Analysis
Advanced bearish analysis identifies high-probability reversals by filtering patterns through H4 or Daily timeframes and institutional volume spikes. Why H4 patterns are 35% more accurate than H1 signals reflects a fundamental principle of technical analysis, longer timeframes filter out noise created by retail traders executing intraday scalps. Institutional traders operate on H4 and Daily timeframes, meaning volume spikes on these timeframes indicate genuine capital flow rather than algorithm micro-transactions.
“Three Black Crows” (three consecutive bearish candles) identifies institutional distribution vs. retail profit-taking by showing sustained selling pressure rather than a single reversal candle. Combining candlesticks with RSI/MACD momentum confirms 2026 trend reversal by revealing divergence between price and momentum, when price makes a higher high but momentum fails to confirm it, bearish candlestick patterns gain additional credibility.
choosing the right timeframe for charts explains how timeframe selection impacts trading results and demonstrates why higher timeframes reduce false signals. wick and shadow significance details the meaning of upper and lower wicks and explains how extended wicks signal rejection levels that become entry points for subsequent reversals.
Key Takeaways
- Bearish candlestick patterns identify market turning points where sellers overwhelm buyers at price peaks.
- The Evening Star pattern reveals a 72% historical success rate, making it the most reliable 2026 reversal signal.
- Confirmation entries indicate a 68% reliability boost compared to trading patterns immediately upon completion.
- Bearish Engulfing strategies achieve a 60-65% win rate when validated with high relative volume.
- Higher timeframe patterns (H4 and Daily) demonstrate 35% greater accuracy than intraday 15-minute signals.
- Institutional distribution signals like ‘Three Black Crows’ reveal large-scale capital exits from a trend.
Frequently Asked Questions
This article contains references to bearish candlestick patterns, technical analysis strategies, and Volity, a regulated CFD trading platform. This content is produced for educational purposes only and does not constitute financial advice or a recommendation to buy or sell any financial instrument. Always verify current market conditions and platform details before trading. Some links in this article may be affiliate links.
[/coi_disclosure]
What our analysts watch: Three filters that lift bearish-pattern win rates from coin-flip to genuinely informative. Pattern location relative to the larger trend (a bearish reversal at a 200-period moving-average rejection is a different setup from the same pattern printing inside a trading range; the location is half the signal). Volatility regime at the time of formation (patterns inside compressed-volatility periods carry tighter stops and clearer follow-through; the CBOE volatility surface is the cleanest live read on which regime is active). Confirmation cadence (waiting for the next-bar close beyond the pattern is the difference between trading the pattern and trading anticipation of the pattern; published backtests consistently show the confirmation filter raises win rate by 5 to 12 points across major patterns).
Volity operates a trading platform and also publishes educational and analytical content about trading. The content on this page is for educational purposes only and should not be considered financial advice. Volity may benefit commercially when readers open trading accounts through links on this site.
Our content is produced and reviewed under documented editorial standards; comparison and review methodology is published here.