Kurze Antwort
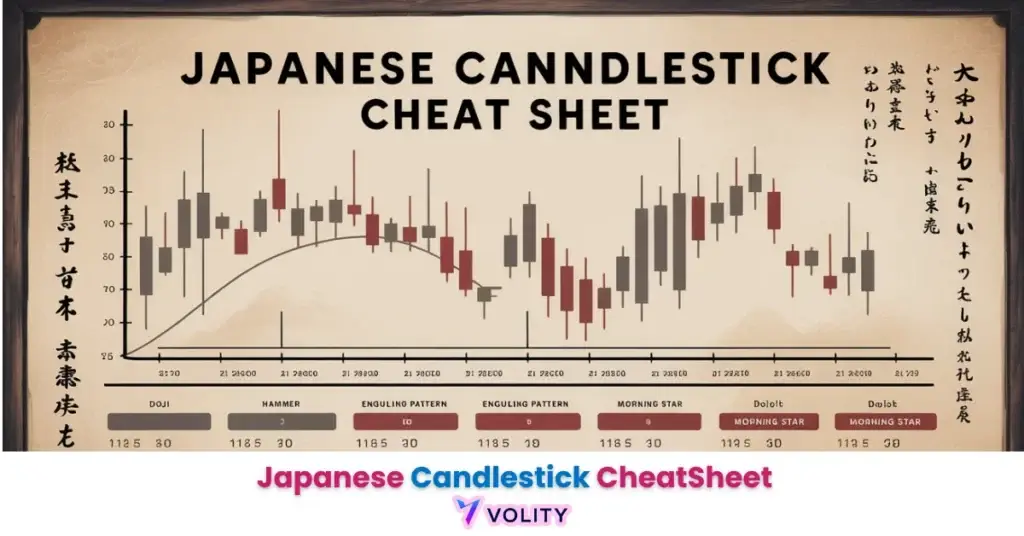
Ein japanischer Kerzen-Spickzettel ist ein Kurzreferenz-Leitfaden zu den wichtigsten Kerzenmustern und was sie signalisieren, gruppiert in bullische, bärische und Fortsetzungsmuster wie Doji, Hammer, Engulfing und Morning Star. Er hilft Tradern, Umkehrungen und Momentum auf einen Blick zu erkennen. Muster funktionieren am besten mit Bestätigung und Kontext, nicht isoliert.
Investitionen in Finanzprodukte sind mit Risiken verbunden. Verluste können den Wert Ihrer ursprünglichen Investition übersteigen.
Jede Forex-Bewegung hinterlässt einen Fußabdruck. Japanische Candlesticks erfassen diese Spur, bestehend aus Eröffnungs-, Höchst-, Tiefst- und Schlusskurs, und bilden Muster, die Trader lesen und für ihren Erfolg nutzen können.
Daher haben wir ein praktisches Spickzettel-Referenzblatt für das Trading mit japanischen Candlesticks erstellt. Es vereint die zuverlässigsten Candlestick-Muster mit klarer Richtung, Struktur und Handelssignalen. Sie sehen auf einen Blick, welche Kerzen auf Umkehrungen hindeuten, welche Trends fortsetzen und wie Sie diese in echten Charts erkennen.
Das Verständnis von Japanische Candlestick-Spickzettel ist wichtig, doch echtes Wachstum entsteht erst durch die Anwendung dieses Wissens. Kostenloses Forex-Handelskonto erstellen, um mit einem kostenlosen Demokonto zu üben und Ihre Strategie zu testen.
Was ist ein japanisches Candlestick-Muster?
Ein japanischer Candlestick ist eine spezielle Art von Preischart, der im Forex- und Aktienhandel verwendet wird. Er zeigt, wie stark sich der Preis in einem bestimmten Zeitraum bewegt hat, egal ob eine Minute, eine Stunde oder ein Tag. Jeder Candlestick liefert vier Details: Eröffnungskurs, Schlusskurs, Höchstkurs und Tiefstkurs.
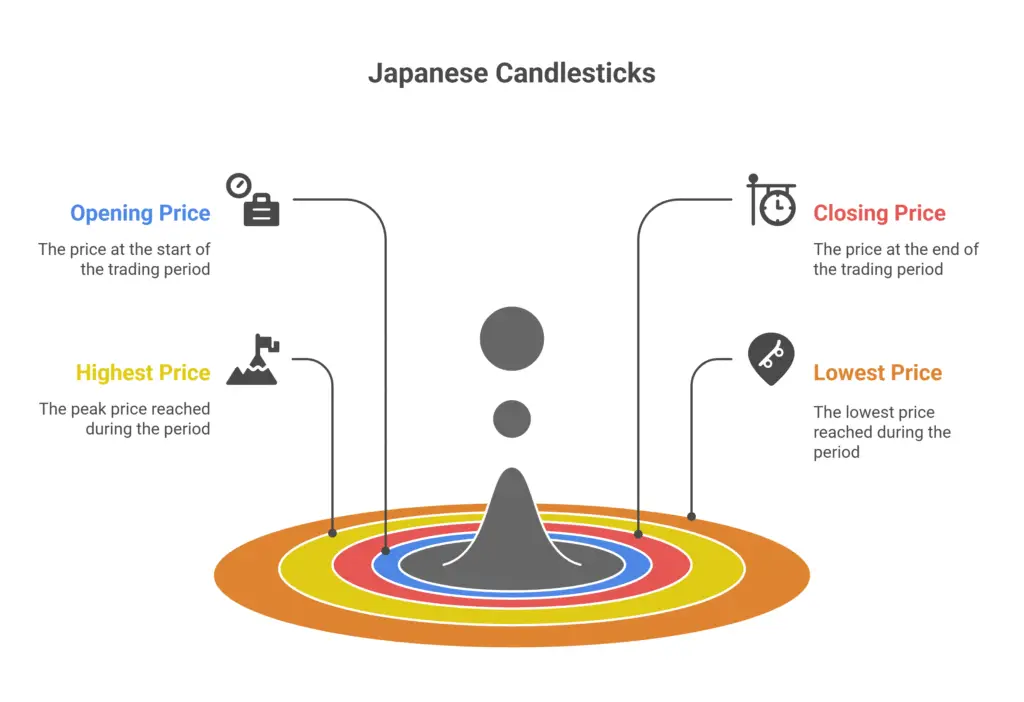
Im Gegensatz zu einfachen Balken- oder Liniendiagrammen zeigen japanische Candlesticks diese Preisbewegung in einem visuellen Blockformat. Der Körper der Kerze gibt an, ob der Preis gestiegen oder gefallen ist (bullisch oder bärisch), und die Dochte (Schatten) zeigen, wie hoch oder niedrig der Preis war, bevor er sich stabilisierte.
Candlestick-Muster gibt es in zwei Kategorien:
- Einzelne Candlestick-Muster wie Doji, Hammer und Marubozu
- Mehrfache Candlestick-Muster, die aus zwei (wie Engulfing oder Tweezer Tops) oder drei Kerzen (wie Morning Star oder Three White Soldiers) bestehen können
Jedes Muster gibt Einblick in die Marktpsychologie: ob Käufer die Kontrolle haben, Verkäufer schwächer werden oder eine Umkehr bevorstehen könnte. Zum Beispiel:
- Ein Doji zeigt Unentschlossenheit
- Ein Marubozu zeigt die volle Kontrolle durch Käufer oder Verkäufer
- Ein Bullish Engulfing deutet auf einen Wechsel von bärischer zu bullischer Stimmung hin
Japanische Candlesticks unterscheiden sich von einfachen Kerzen in Standard-Charts. Was sie „japanisch“ macht, ist ihre strukturierte visuelle Form und das tiefgreifende Mustererkennungssystem, das vor Jahrhunderten von japanischen Reishändlern entwickelt wurde. All diese Muster leiten moderne Trader noch heute bei Entscheidungen in Echtzeit.
Bereit, Ihr Trading auf das nächste Level zu bringen?
Sie haben das Wissen. Jetzt fehlt die Plattform. Schließen Sie sich Tausenden erfolgreichen Tradern an, die Volity für leistungsstarke Tools, schnelle Ausführung und engagierten Support nutzen.
Erstellen Sie Ihr Konto in unter 3 MinutenWas ist ein japanischer Candlestick-Spickzettel und warum sollte man ihn nutzen?
Ein Candlestick-Spickzettel ist eine Kurzreferenz gängiger japanischer Candlestick-Muster, gruppiert nach ihrer Richtungsneigung: bullisch oder bärisch. Er hilft Tradern, sofort zu erkennen, wie ein Muster aussieht, was es signalisiert und wie man darauf reagiert. Im Gegensatz zu langen Erklärungen fasst ein Spickzettel die wichtigsten Merkmale in einem Raster zusammen:
- Anzahl der Candlesticks
- Richtung (bullisch oder bärisch)
- Typ (Umkehr oder Fortsetzung)
- Typische Struktur
Warum sollte man ihn nutzen?
Nehmen wir an, der Markt steigt stark an. Eine Kerze erscheint mit einem langen oberen Docht und einem kleinen Körper nahe dem unteren Ende. Sie sind unsicher, ob es ein Signal oder nur Rauschen ist. Ein Blick auf Ihren Spickzettel: Es entspricht einem Shooting Star. Das ist ein bärisches Umkehrsignal, das oft nach Aufwärtstrends auftritt. Sie halten sich mit dem Kauf zurück und warten ab. Die nächste Kerze bestätigt den Rückgang. Der Spickzettel hat Ihnen gerade geholfen, eine Falle zu vermeiden.
Es ist auch möglich, dass der Preis nach einem Abwärtstrend zu einem anderen Zeitpunkt stagniert. Eine lange grüne Kerze ohne Dochte erscheint: ein Bullish Marubozu. Sie prüfen den Spickzettel erneut. Er besagt, dass die Käufer die volle Kontrolle haben. Eine Umkehr könnte beginnen. Sie planen Ihren Long-Einstieg mit mehr Klarheit.
So stellt ein Spickzettel sicher, dass jeder Blick auf den Chart schneller, präziser und fundierter wird. Tatsächlich halten professionelle Trader ihn oft neben ihrer Routine-Checkliste bereit, um sicherzustellen, dass technische Signale in einen strukturierten täglichen Arbeitsablauf passen.
Der ultimative japanische Candlestick-Spickzettel
Wir haben diesen Spickzettel als praktische, referenzbasierte Zusammenfassung aller wichtigen japanischen Candlestick-Muster zusammengestellt. Er schlüsselt jedes Signal nach Struktur, Richtung und Zweck auf, damit Sie bullische oder bärische Absichten auf einen Blick erkennen können.
Einzelne Candlestick-Muster
| Mustername | Anzahl Kerzen | Richtung | Struktur | Aktion |
| Hammer | 1 | Bullisch | Kleiner Körper, langer unterer Docht | Umkehr am Ende eines Abwärtstrends |
| Inverse Hammer | 1 | Bullisch | Kleiner Körper, langer oberer Docht | Umkehrhinweis nach einem Rückgang |
| Hanging Man | 1 | Bärisch | Kleiner Körper, langer unterer Docht | Warnung am Ende eines Aufwärtstrends |
| Shooting Star | 1 | Bärisch | Kleiner Körper, langer oberer Docht | Umkehrhinweis am Hoch |
| Doji | 1 | Neutral | Eröffnung = Schluss | Unentschlossenheit, mögliche Umkehr |
| Spinning Top | 1 | Neutral | Kleiner Körper, lange Dochte an beiden Enden | Unentschlossenheit, nachlassendes Momentum |
| Bullish Marubozu | 1 | Bullisch | Voller grüner Körper, keine Dochte | Starke Aufwärtsfortsetzung |
| Bearish Marubozu | 1 | Bärisch | Voller roter Körper, keine Dochte | Starke Abwärtsfortsetzung |
Doppelte Candlestick-Muster
| Mustername | Anzahl Kerzen | Richtung | Struktur | Aktion |
| Bullish Engulfing | 2 | Bullisch | Rote Kerze von großer grüner umschlossen | Umkehr am Tief |
| Bearish Engulfing | 2 | Bärisch | Grüne Kerze von großer roter umschlossen | Umkehr am Hoch |
| Piercing Line | 2 | Bullisch | Lange rote, dann grüne öffnet tiefer, schließt hoch | Bullische Umkehr mit Gap |
| Dark Cloud Cover | 2 | Bärisch | Grüne gefolgt von roter, die mehr als 50 % durchdringt | Bärische Umkehrwarnung |
| Tweezer Bottoms | 2 | Bullisch | Identische Tiefs, rot dann grün | Doppeltest der Unterstützung |
| Tweezer Tops | 2 | Bärisch | Identische Hochs, grün dann rot | Doppeltest des Widerstands |
| Bullish Harami | 2 | Bullisch | Große rote gefolgt von kleiner grüner darin | Umkehr oder Fortsetzung |
| Bearish Harami | 2 | Bärisch | Große grüne gefolgt von kleiner roter darin | Umkehr oder Fortsetzung |
Dreifache Candlestick-Muster
| Mustername | Anzahl Kerzen | Richtung | Struktur | Aktion |
| Morning Star | 3 | Bullisch | Lange rote, kleiner Körper, lange grüne | Starke Umkehr nach Rückgang |
| Evening Star | 3 | Bärisch | Lange grüne, kleiner Körper, lange rote | Starke Umkehr nach Rallye |
| Three White Soldiers | 3 | Bullisch | Drei starke grüne Kerzen, jede schließt höher | Umkehr und Start Aufwärtstrend |
| Three Black Crows | 3 | Bärisch | Drei starke rote Kerzen, jede schließt tiefer | Umkehr und Start Abwärtstrend |
| Rising Three Methods | 5 | Bullisch | Grün, 3 kleine rote, große grüne | Fortsetzung Aufwärtstrend |
| Falling Three Methods | 5 | Bärisch | Rot, 3 kleine grüne, große rote | Fortsetzung Abwärtstrend |
Wie verwendet man den japanischen Candlestick-Spickzettel?
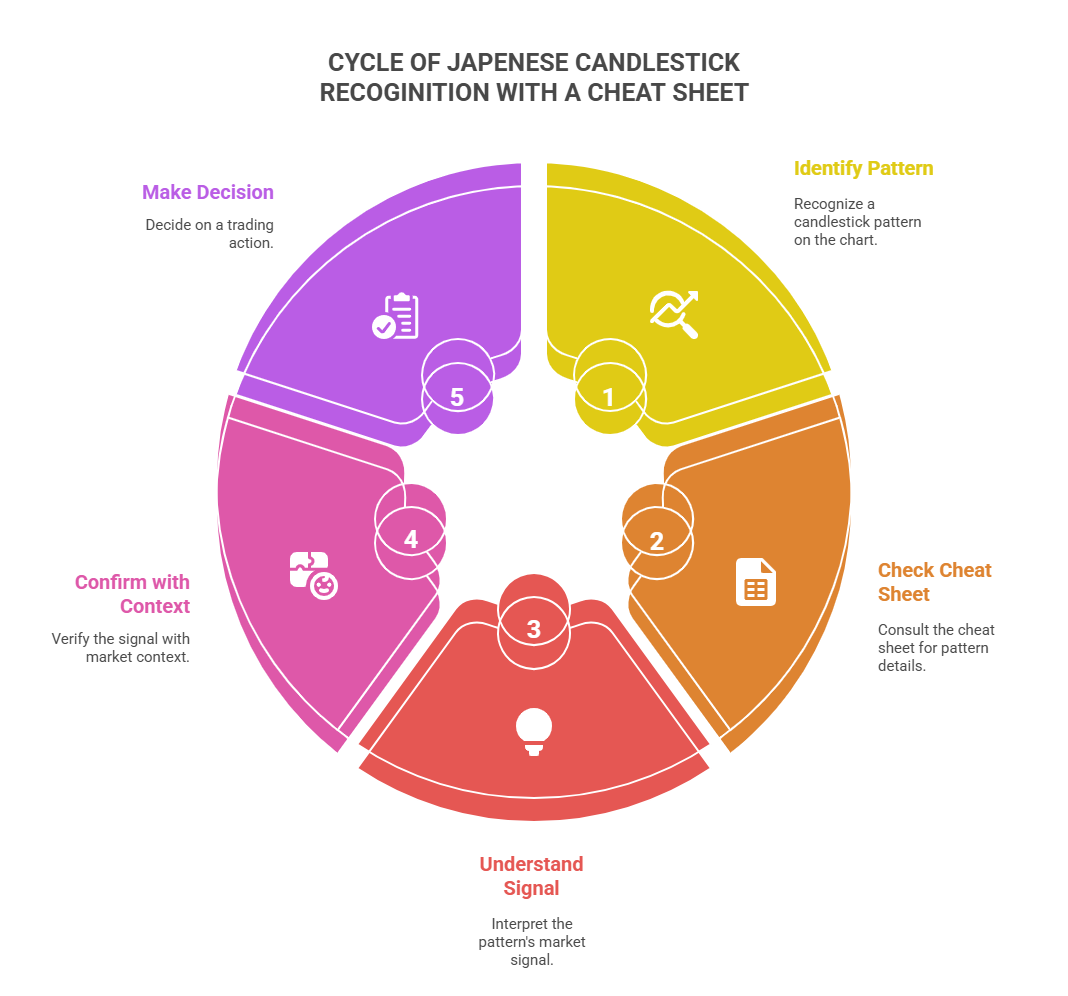
Der Spickzettel fungiert als Ihr Leitfaden zur Mustererkennung. Bewahren Sie ihn neben Ihrem Trading-Bildschirm auf. Jedes Mal, wenn Ihnen eine Kerze oder ein Cluster auffällt, vergleichen Sie es mit der Abbildung auf dem Blatt. Sehen Sie, was es signalisiert. Bestätigen Sie es dann mit dem Preiskontext.
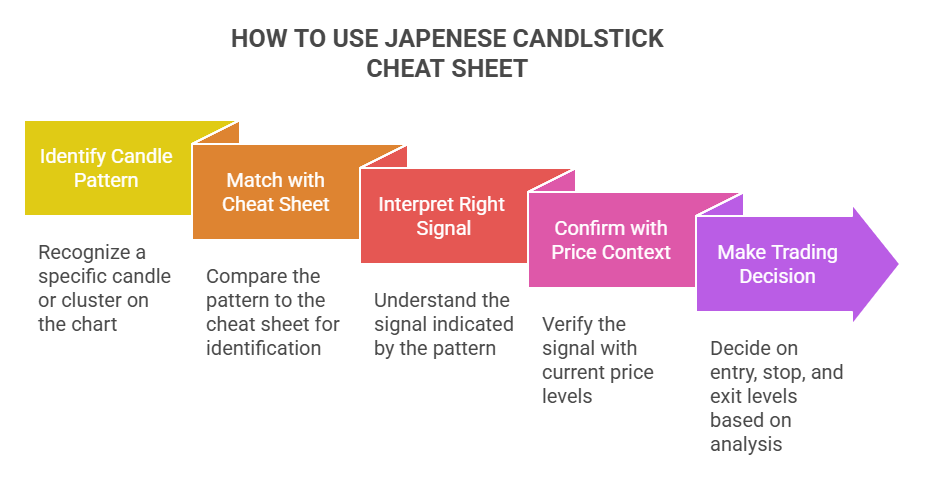
Lassen Sie uns das anhand von Beispielen aufschlüsseln:
- Während einer starken Rallye erscheint eine Kerze mit kleinem Körper und langen Dochten. Sie prüfen den Spickzettel. Es entspricht einem Spinning Top, einem Zeichen für Unentschlossenheit. Sie überstürzen nichts. Sie warten auf die nächste Bewegung, bevor Sie einsteigen.
- Nach einem starken Fall bildet sich eine Kerze mit gleichem Eröffnungs- und Schlusskurs sowie langen Schatten: ein Doji. Der Spickzettel erinnert Sie daran, dass dies Erschöpfung signalisiert. Sie kombinieren es mit Unterstützungsniveaus. Ein Abprall folgt. Sie handeln mit mehr Zuversicht.
- Am Widerstand erscheint ein Bearish Engulfing: eine große rote Kerze verschlingt die vorherige grüne. Der Spickzettel bestätigt, dass es ein Umkehrsignal ist. Sie bereiten Ihren Short-Plan vor.
Sie können den japanischen Candlestick-Spickzettel nutzen, um:
- Das Muster schnell zu identifizieren
- Zu verstehen, ob es bullisch, bärisch oder neutral ist
- Es mit Volumen, Unterstützung/Widerstand oder Trendlinien zu kombinieren
- Ihre Einstiegs-, Stop- und Ausstiegsniveaus festzulegen
Mit der Zeit werden die Muster auswendig gelernt. Aber bis dahin beschleunigt der Spickzettel Ihr Lernen und schärft Ihre Entscheidungen.
Wissen in Gewinn verwandeln
Sie haben gelesen, jetzt ist es Zeit zu handeln. Der beste Weg zu lernen ist durch Praxis. Eröffnen Sie ein kostenloses, risikofreies Demokonto und üben Sie Ihre Strategie noch heute mit virtuellem Guthaben.
Kostenloses Demokonto eröffnenAbschließende Worte
Es reicht nicht aus, einfach nur Candlestick-Namen oder -Formen auswendig zu lernen. Sie müssen verstehen, wo und warum sie erscheinen. Stellen Sie also sicher, dass jedes Muster, das Sie lesen, mit Trends, Unterstützungszonen oder Volumenverschiebungen verknüpft ist. Ein Spickzettel hilft Ihnen beim Erinnern. Aber echte Trades hängen von der Platzierung ab.
Ein Doji nahe einem Widerstand bedeutet etwas. Ein Hammer nach einem Ausverkauf zeigt Druck. Ohne Kontext führt selbst ein perfektes Muster in die Irre. Halten Sie den Spickzettel also griffbereit, aber gleichen Sie jedes Signal immer mit der echten Marktlogik ab, bevor Sie handeln.
FAQs
Verwandte Ratgeber
Volity betreibt eine Handelsplattform und veröffentlicht außerdem Bildungs- und Analyseinhalte zum Thema Trading. Die Inhalte dieser Seite dienen ausschließlich Bildungszwecken und sind nicht als Finanzberatung zu verstehen. Volity kann kommerziell profitieren, wenn Leser über Links auf dieser Website Handelskonten eröffnen.
Unsere Inhalte werden nach dokumentierten redaktionellen Standards erstellt und geprüft; siehe unsere Vergleichs- und Bewertungsmethodik.