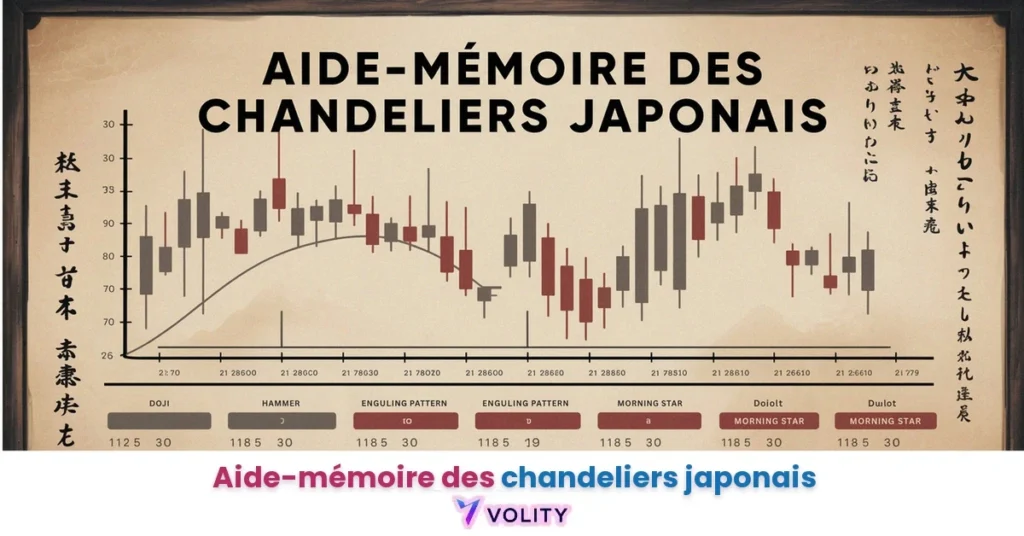
Réponse rapide
Un aide-mémoire des chandeliers japonais est un guide de référence rapide des principales figures en chandeliers et de ce qu’elles signalent, regroupées en figures haussières, baissières et de continuation comme le doji, le marteau, l’avalement et l’étoile du matin. Il aide les traders à repérer retournements et momentum d’un coup d’œil. Les figures fonctionnent mieux avec confirmation et contexte, pas isolément.
Investir dans des produits financiers comporte des risques. Les pertes peuvent dépasser la valeur de votre investissement initial.
Chaque mouvement sur le Forex laisse une trace. Les chandeliers japonais capturent cette trace, l’ouverture, le plus haut, le plus bas et la clôture, cartographiés en figures que les traders peuvent lire pour gagner.
Nous avons donc créé une fiche mémo de référence rapide pour le trading des chandeliers japonais. Elle rassemble les figures de chandeliers les plus fiables avec une direction, une structure et des signaux de trading clairs. Vous verrez quelles bougies indiquent des retournements, lesquelles poursuivent les tendances et comment les reconnaître sur des graphiques réels.
Comprendre Fiche mémo des chandeliers japonais est important, mais la vraie progression commence en appliquant ces connaissances. Créez votre compte de trading forex gratuit pour vous entraîner sur un compte démo gratuit et mettre votre stratégie à l’épreuve.
Qu’est-ce qu’une figure de chandelier japonais ?
Un chandelier japonais est un type spécial de graphique de prix utilisé dans le trading Forex et boursier. Il montre à quel point le prix a bougé sur une période donnée, qu’il s’agisse d’une minute, d’une heure ou d’un jour. Chaque chandelier fournit quatre détails : le prix d’ouverture, le prix de clôture, le prix le plus haut et le prix le plus bas.
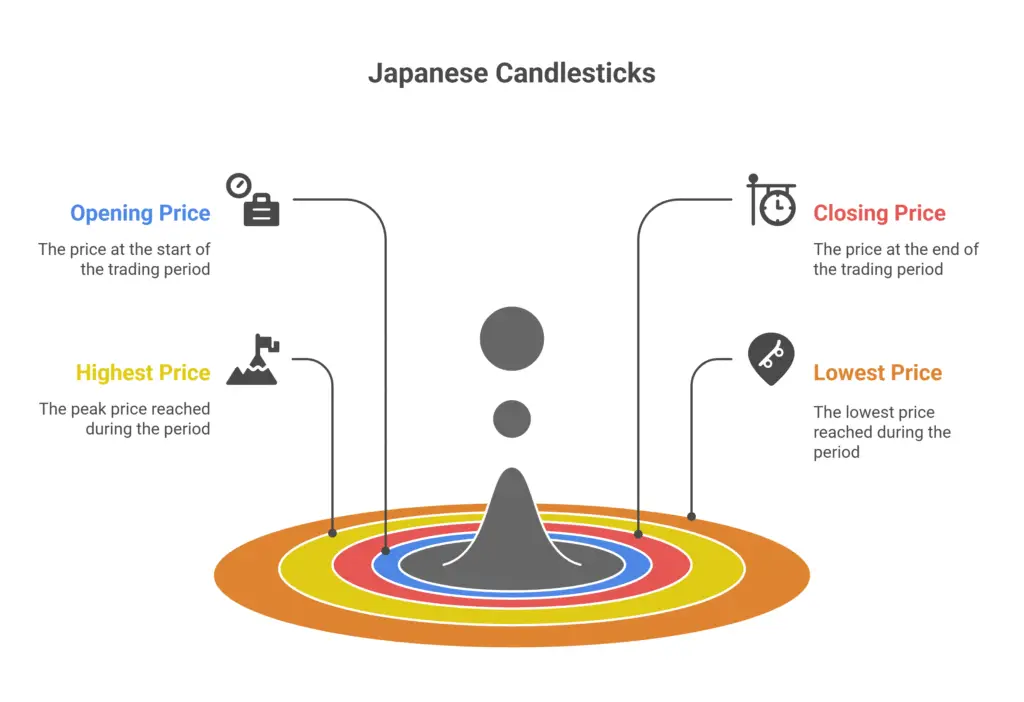
Contrairement aux graphiques en barres ou en lignes simples, les chandeliers japonais montrent ce mouvement de prix dans un format visuel en bloc. Le corps de la bougie indique si le prix a augmenté ou diminué (haussier ou baissier), et les mèches (ombres) montrent jusqu’où le prix est monté ou descendu avant de se stabiliser.
Les figures de chandeliers se divisent en deux parties :
- Figures à un seul chandelier comme le Doji, le Marteau et le Marubozu
- Figures à plusieurs chandeliers, qui peuvent être doubles (comme l’Engulfing ou les Tweezer Tops) ou triples (comme l’Étoile du matin ou les Trois soldats blancs)
Chaque figure donne un aperçu de la psychologie du marché : si les acheteurs ont le contrôle, si les vendeurs s’affaiblissent ou si un retournement pourrait se produire. Par exemple :
- Un Doji montre une indécision
- Un Marubozu montre un contrôle total des acheteurs ou des vendeurs
- Un Engulfing haussier indique un passage d’un sentiment baissier à un sentiment haussier
Les chandeliers japonais sont différents des chandeliers simples trouvés dans les graphiques de base. Ce qui les rend « japonais », c’est leur forme visuelle structurée et le système approfondi de reconnaissance des figures développé par les négociants en riz japonais il y a des siècles. Toutes ces figures guident encore les traders modernes dans leurs décisions en temps réel.
Prêt à faire passer votre trading au niveau supérieur ?
Vous avez les connaissances. Il vous manque la plateforme. Rejoignez des milliers de traders qui choisissent Volity pour ses outils puissants, son exécution rapide et son support dédié.
Créez votre compte en moins de 3 minutesQu’est-ce qu’une fiche mémo des chandeliers japonais et pourquoi l’utiliser ?
Une fiche mémo de chandeliers est un résumé de référence rapide des figures de chandeliers japonais courantes, regroupées par leur biais directionnel : haussier ou baissier. Elle aide les traders à reconnaître instantanément à quoi ressemble une figure, ce qu’elle signale et comment agir en conséquence. Contrairement aux explications longues, une fiche mémo condense les traits clés dans une grille :
- Nombre de chandeliers
- Direction (haussière ou baissière)
- Type (retournement ou continuation)
- Structure typique
Maintenant, pourquoi l’utiliser ?
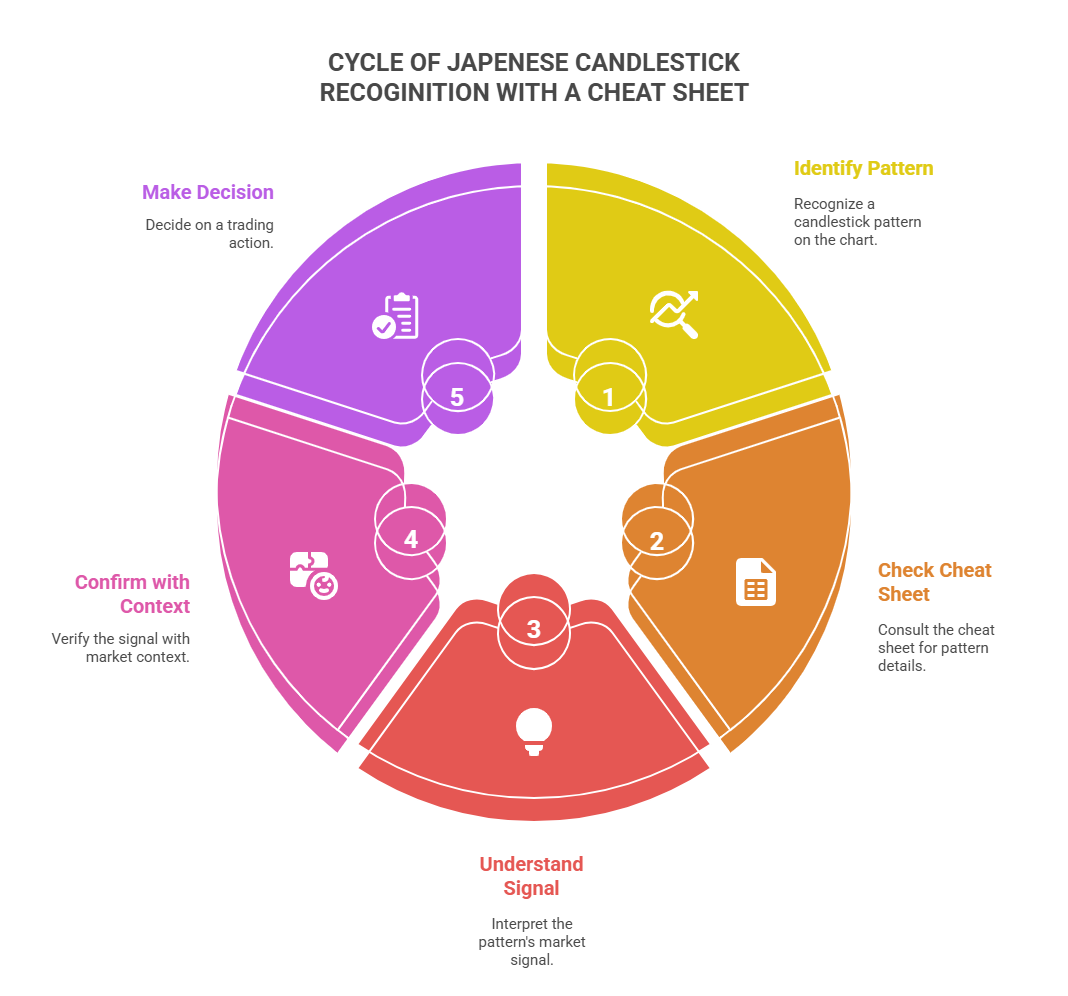
Disons que le marché grimpe fortement. Une bougie apparaît avec une longue mèche supérieure et un petit corps près du bas. Vous n’êtes pas sûr s’il s’agit d’un signal ou juste de bruit. Un coup d’œil à votre fiche mémo : cela correspond à une Étoile filante. C’est un signal de retournement baissier, souvent observé après des tendances haussières. Vous vous abstenez d’acheter et attendez. La bougie suivante confirme avec une baisse. La fiche mémo vient de vous aider à éviter un piège.
Il est également possible que le prix stagne après une tendance baissière à un autre moment. Une longue bougie verte apparaît sans mèches : un Marubozu haussier. Vous vérifiez à nouveau la fiche mémo. Elle indique que les acheteurs ont le contrôle total. Un retournement pourrait commencer. Vous planifiez votre entrée longue avec plus de clarté.
C’est ainsi qu’une fiche mémo garantit que chaque coup d’œil au graphique devient plus rapide, plus précis et mieux informé. En fait, les traders professionnels la gardent souvent à côté de leur liste de contrôle de routine pour s’assurer que les signaux techniques s’intègrent dans un flux de travail quotidien structuré.
La fiche mémo ultime des chandeliers japonais
Nous avons compilé cette fiche mémo comme un résumé pratique et documenté de toutes les figures clés de chandeliers japonais. Elle décompose chaque signal par structure, direction et objectif, afin que vous puissiez reconnaître l’intention haussière ou baissière en un coup d’œil.
Figures à un seul chandelier
| Nom de la figure | Nb de bougies | Direction | Structure | Action |
| Marteau | 1 | Haussier | Petit corps, longue mèche inférieure | Retournement au bas d’une tendance baissière |
| Marteau inversé | 1 | Haussier | Petit corps, longue mèche supérieure | Indice de retournement après une baisse |
| Homme pendu | 1 | Baissier | Petit corps, longue mèche inférieure | Avertissement au sommet d’une tendance haussière |
| Étoile filante | 1 | Baissier | Petit corps, longue mèche supérieure | Indice de retournement au sommet |
| Doji | 1 | Neutre | Ouverture = Clôture | Indécision, retournement potentiel |
| Toupie | 1 | Neutre | Petit corps, longues mèches aux deux extrémités | Indécision, affaiblissement du momentum |
| Marubozu haussier | 1 | Haussier | Corps vert plein, sans mèches | Forte continuation haussière |
| Marubozu baissier | 1 | Baissier | Corps rouge plein, sans mèches | Forte continuation baissière |
Figures à deux chandeliers
| Nom de la figure | Nb de bougies | Direction | Structure | Action |
| Engulfing haussier | 2 | Haussier | Bougie rouge engloutie par une grande verte | Retournement au bas |
| Engulfing baissier | 2 | Baissier | Bougie verte engloutie par une grande rouge | Retournement au sommet |
| Ligne de percée | 2 | Haussier | Rouge longue, puis verte ouvre plus bas, clôture haut | Retournement haussier avec gap |
| Couverture en nuage noir | 2 | Baissier | Verte suivie d’une rouge perçant plus de 50 % | Avertissement de retournement baissier |
| Tweezer Bottoms | 2 | Haussier | Plus bas identiques, rouge puis verte | Double test de support |
| Tweezer Tops | 2 | Baissier | Plus hauts identiques, verte puis rouge | Double test de résistance |
| Harami haussier | 2 | Haussier | Grande rouge suivie d’une petite verte à l’intérieur | Retournement ou continuation |
| Harami baissier | 2 | Baissier | Grande verte suivie d’une petite rouge à l’intérieur | Retournement ou continuation |
Figures à trois chandeliers
| Nom de la figure | Nb de bougies | Direction | Structure | Action |
| Étoile du matin | 3 | Haussier | Rouge longue, petit corps, verte longue | Fort retournement après une baisse |
| Étoile du soir | 3 | Baissier | Verte longue, petit corps, rouge longue | Fort retournement après une hausse |
| Trois soldats blancs | 3 | Haussier | Trois bougies vertes fortes, chacune clôturant plus haut | Retournement et début de tendance haussière |
| Trois corbeaux noirs | 3 | Baissier | Trois bougies rouges fortes, chacune clôturant plus bas | Retournement et début de tendance baissière |
| Rising Three Methods | 5 | Haussier | Verte, 3 petites rouges, grande verte | Continuation de tendance haussière |
| Falling Three Methods | 5 | Baissier | Rouge, 3 petites vertes, grande rouge | Continuation de tendance baissière |
Comment utiliser la fiche mémo des chandeliers japonais ?
La fiche mémo fonctionne comme votre guide de reconnaissance des figures. Gardez-la à côté de votre écran de trading. Chaque fois qu’une bougie ou un groupe attire votre attention, comparez-le avec le visuel sur la fiche. Voyez ce qu’il signale. Ensuite, confirmez avec le contexte du prix.
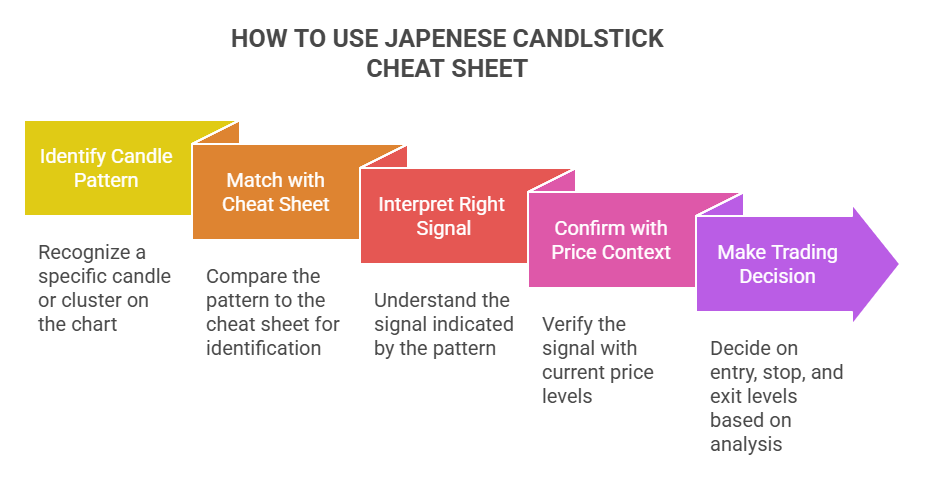
Décomposons cela avec des exemples :
- Pendant une forte hausse, une bougie à petit corps avec de longues mèches apparaît. Vous vérifiez la fiche mémo. Cela correspond à une Toupie, un signe d’indécision. Vous ne vous précipitez pas. Vous attendez le mouvement suivant avant d’entrer.
- Après une chute brutale, une bougie se forme avec une ouverture et une clôture égales et de longues ombres : un Doji. La fiche mémo vous rappelle qu’il signale un épuisement. Vous le combinez avec les niveaux de support. Un rebond suit. Vous agissez avec plus de confiance.
- À la résistance, un Engulfing baissier apparaît : une grosse bougie rouge avale la précédente verte. La fiche mémo confirme qu’il s’agit d’un signal de retournement. Vous préparez votre plan de vente à découvert.
Vous pouvez utiliser la fiche mémo des chandeliers japonais pour :
- Identifier la figure rapidement
- Comprendre si elle est haussière, baissière ou neutre
- Combiner avec le volume, le support/résistance ou les lignes de tendance
- Décider de vos niveaux d’entrée, de stop et de sortie
Avec le temps, les figures sont mémorisées. Mais jusque-là, la fiche mémo accélère votre apprentissage et affine vos décisions.
Transformez vos connaissances en profit
Vous avez lu, il est temps d’agir. La meilleure façon d’apprendre, c’est en pratiquant. Ouvrez un compte démo gratuit et sans risque et entraînez votre stratégie avec des fonds virtuels dès aujourd’hui.
Ouvrir un compte démo gratuitDerniers mots
Il ne suffit pas de simplement mémoriser les noms ou les formes des chandeliers. Vous devez comprendre où et pourquoi ils apparaissent. Assurez-vous donc que chaque figure que vous lisez est liée aux tendances, aux zones de support ou aux changements de volume. Une fiche mémo vous aide à vous souvenir. Mais les vrais trades dépendent du placement.
Un Doji près d’une résistance signifie quelque chose. Un Marteau après une vente massive montre une pression. Sans contexte, même une figure parfaite induit en erreur. Gardez donc la fiche mémo à portée de main, mais associez toujours chaque signal à une logique de marché réelle avant d’agir.
FAQ
Guides associés
- Figure du Doji libellule
- Couverture en nuage noir
- Figure du drapeau haussier
- Figure du drapeau baissier
- Plateformes de trading sur graphique
Volity exploite une plateforme de trading et publie également du contenu éducatif et analytique sur le trading. Le contenu de cette page est uniquement à des fins éducatives et ne doit pas être considéré comme un conseil financier. Volity peut bénéficier commercialement lorsque les lecteurs ouvrent des comptes de trading via les liens présents sur ce site.
Notre contenu est produit et révisé selon des standards éditoriaux documentés ; consultez notre méthodologie de comparaison et de revue.