Der Handel mit bärischen Candlestick-Mustern birgt Marktrisiken und erfordert eine präzise Bestätigung des Einstiegs. Muster mit hoher Erfolgsquote wie der Evening Star garantieren keine zukünftigen Gewinne. Die Wertentwicklung in der Vergangenheit ist kein Indikator für zukünftige Ergebnisse. Kapital ist gefährdet.
Bärische Candlestick-Muster sind visuelle Formationen, die einen Wechsel von der Kontrolle der Käufer zur Dominanz der Verkäufer anzeigen. Das Evening Star-Muster zählt zu den meistzitierten bärischen Umkehrformationen aus drei Kerzen, und das Abwarten einer Bestätigung durch die nächste Kerze macht jede dieser Formationen deutlich zuverlässiger.
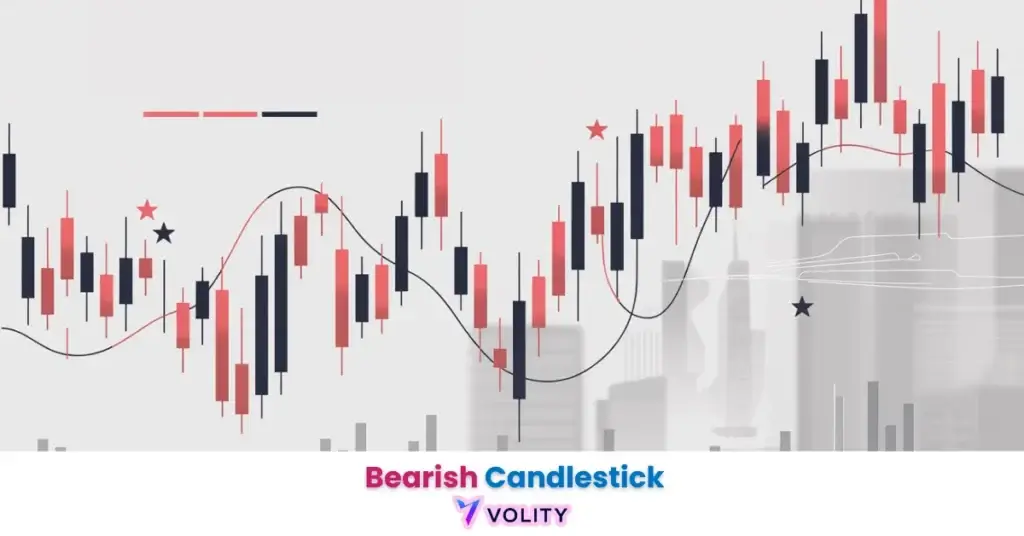
Bärische Candlestick-Muster identifizieren den Übergang von bullischem Momentum zu einer Abwärtsbewegung. Diese visuellen Formationen offenbaren den psychologischen Kampf, bei dem Verkäufer die Käufer überwinden, was auf eine hohe Wahrscheinlichkeit einer Trenderschöpfung hindeutet.
Während viele Trader diese Formen erkennen, erfordert ihre erfolgreiche Umsetzung eine disziplinierte Bestätigung. Wer jedes Muster im Kontext des Trends und des Niveaus liest, an dem es sich bildet, kann Ausstiege besser verwalten und Short-Selling-Strategien mit größerer Präzision einsetzen.
Das Verständnis von Bärisches Candlestick-Muster ist wichtig, doch echtes Wachstum entsteht erst durch die Anwendung dieses Wissens. Kostenloses Forex-Handelskonto erstellen, um mit einem kostenlosen Demokonto zu üben und Ihre Strategie zu testen.
Was ist ein bärisches Candlestick-Muster und wie entsteht es?
Ein bärisches Candlestick-Muster ist eine visuelle Preisformation, die nach einem anhaltenden Aufwärtstrend auf die Dominanz der Verkäufer hinweist. Die Anatomie einer bärischen Kerze offenbart drei kritische Komponenten: den oberen Docht (das Hoch), den realen Körper (die Differenz zwischen Eröffnung und Schluss) und den unteren Docht oder Schatten. Diese Struktur identifiziert Bereiche, in denen Käufer versuchten, die Preise nach oben zu drücken, aber auf ablehnenden Verkaufsdruck stießen.
Der Wechsel von der Erschöpfung der Käufer zur Aggression der Verkäufer stellt eine fundamentale Momentum-Änderung dar. Aufwärtstrends halten an, weil jede Preisrallye neue Käufer anzieht, die bereit sind, zu höheren Preisen zu akkumulieren. Sobald Verkäufer beginnen, diese Nachfrage zu überwältigen, bilden sich Umkehrungen; das visuelle Muster selbst signalisiert den genauen Moment, in dem die Marktkontrolle wechselt. Eine Volumenvalidierung bestätigt diesen Übergang; wenn eine bärische Kerze bei erhöhtem Volumen im Vergleich zum vorherigen Aufwärtstrend schließt, gewinnt das Muster an Glaubwürdigkeit.
Wie man Candlestick-Charts liest bietet detaillierte Anleitungen zur Interpretation der einzelnen Komponenten bärischer Formationen und zum Verständnis, wie Dochte, Körper und Schlusskurse interagieren, um Umkehrungen zu signalisieren. Das Abwarten eines bestätigten Schlusskurses unter dem Tief eines Musters ist die Disziplin, die Fehlsignale eliminiert, bei denen Dochte unter die Unterstützung reichen, der Preis aber nie dort schließt.
Bereit, Ihr Trading auf das nächste Level zu bringen?
Sie haben das Wissen. Jetzt fehlt die Plattform. Schließen Sie sich Tausenden erfolgreichen Tradern an, die Volity für leistungsstarke Tools, schnelle Ausführung und engagierten Support nutzen.
Erstellen Sie Ihr Konto in unter 3 MinutenWelches bärische Candlestick-Muster ist 2026 am zuverlässigsten?
Das Evening Star-Muster gilt unter den bärischen Umkehrungen als das zuverlässigste Signal für Trendhöhepunkte. Diese Drei-Kerzen-Formation beginnt mit einer großen bullischen Kerze, die die Überzeugung im Aufwärtstrend festigt, gefolgt von einer kleineren Kerze mit Kurslücke nach oben, die ein nachlassendes Momentum zeigt, und endet mit einer großen bärischen Kerze, die die anfängliche bullische Bewegung vollständig umkehrt. Die Struktur dieses Musters offenbart, warum Marktteilnehmer es als wichtiges Signal erkennen; der Übergang von Stärke zu Schwäche hin zu entschlossenem Verkauf schafft eine unmissverständliche psychologische Bestätigung.
Der Shooting Star identifiziert eine Intraday-Umkehr, bei der der Preis an einem Hoch abgelehnt wird; für sich allein ist er schwächer als die Mehr-Kerzen-Formationen. Dark Cloud Cover im Vergleich zu Bearish Engulfing offenbart unterschiedliche Risikoprofile; Dark Cloud Cover erfordert einen präzisen Einstieg über dem Hoch der ersten Kerze, während Bearish Engulfing klarere mechanische Einstiegspunkte bietet. Die Unterscheidung ist wichtig, da mechanische Einstiege die emotionale Entscheidungsfindung reduzieren und die Konsistenz der Ausführung verbessern.
Evening Star Umkehrsignal erklärt die spezifische Mechanik dieser Drei-Kerzen-Formation und wann sie sich als Umkehrung mit hoher Überzeugung qualifiziert. Shooting Star Candlestick-Strategie demonstriert Ansätze für den Umkehrhandel mit einer einzelnen Kerze, während Dark Cloud Cover Muster zeigt, wie Preisablehnungen an früheren Hochs Einstiegsgelegenheiten schaffen.
Die „50 % Mittelpunkt-Regel“ identifiziert Signale mit hoher Überzeugung; handeln Sie nur Muster, bei denen die zweite oder dritte Kerze unter dem Mittelpunkt der ersten Kerze schließt. Diese Regel filtert schwache Umkehrungen heraus, bei denen Verkäufer zwar eine marginale Kontrolle gewinnen, aber nicht genügend Überzeugung für anhaltende Abwärtstrends besitzen.
Wie man Bearish Engulfing-Muster für maximalen Gewinn handelt
Bearish Engulfing-Muster führen starke Umkehrsignale aus, wenn die zweite Kerze den Körper der vorangegangenen bullischen Kerze vollständig verschlingt. Das vollständige Verschlingen offenbart eine maximale Stimmungsänderung; Käufer, die die erste Kerze kontrollierten, finden sich beim Schluss der zweiten Kerze in Verlustpositionen wieder, was Margin Calls und Stop-Loss-Orders erzwingt, die in weitere Verkäufe kaskadieren. Eine Volumenbestätigung ist kritisch; die zweite Kerze muss ein höheres relatives Volumen als die erste Kerze aufweisen, um institutionelle Beteiligung statt Gewinnmitnahmen von Privatanlegern anzuzeigen.
Die Platzierung des Stop-Loss über dem Hoch der verschlingenden Kerze stellt sicher, dass eine kurze Rallye (eine „Bullen-Falle“ oder Docht-Durchdringung) die Position nicht liquidiert. Bearish Engulfing funktioniert am besten, wenn es mit hohem Volumen und einem bestätigenden Schlusskurs kombiniert wird; das Abwarten des Tagesschlusses vor dem Einstieg eliminiert Intraday-Whipsaws, die zwar den Widerstand durchbrechen, aber nicht darüber halten können.
Handel mit der Engulfing-Kerze erklärt die Einstiegsmechanik und die Regeln für das Positionsmanagement für dieses Umkehrmuster mit hoher Wahrscheinlichkeit.
Echtes Handelsbeispiel: Auf einem EUR/USD H4-Chart bildete sich ein Bearish Engulfing am Widerstand bei 1,1200 mit einem um 35 % höheren Volumen als im Durchschnitt. Der bestätigende Schlusskurs unter 1,1180 löste die Einstiegsausführung aus. Der Preis fiel in den nächsten 48 Stunden um 120 Pips, als sich der Abwärtstrend in Richtung der Unterstützung bei 1,1080 beschleunigte. Die Wertentwicklung in der Vergangenheit ist kein Indikator für zukünftige Ergebnisse.
Warum sich veröffentlichte Erfolgsquoten widersprechen
Die für Candlestick-Muster genannten Erfolgsquoten schwanken zwischen einzelnen Studien so stark, dass eine einzelne Zahl schlechter ist als gar keine. Der Grund ist, dass das Ergebnis fast vollständig von Entscheidungen abhängt, die die Schlagzeilenzahl nicht zeigt: welches Instrument, welcher Zeitrahmen, wie das Muster im Code definiert wurde, was als Gewinn zählte und wie lange der Trade gehalten wurde. Zwei seriöse Studien derselben Formation können allein durch diese Entscheidungen um dreißig Prozentpunkte auseinanderliegen.
Was jede Version des Tests übersteht, ist die Rangfolge, nicht das Niveau. Formationen aus drei Kerzen schlagen Formationen aus zwei Kerzen, Formationen aus zwei Kerzen schlagen Einzelkerzen, und jede von ihnen wird besser, wenn sie an einem Niveau entsteht, das bereits eine Rolle gespielt hat. Behandeln Sie das Muster als Filter für ein Niveau, das Sie bereits markiert hatten, nicht als eigenständiges Signal. Die Literatur zur technischen Analyse räumt offen ein, wie stark diese Ergebnisse von der Testdefinition abhängen.
Japanese Candlestick Cheat Sheet bietet visuelle Kurzübersichten zur Identifizierung dieser Muster in realen Handelsumgebungen.
💡 KEY INSIGHT: Muster, die auf H4- oder Tages-Charts identifiziert werden, sind deutlich zuverlässiger als Intraday-15-Minuten-Signale, da das Marktgeräusch geringer ist. Institutionelle Trader filtern Intraday-Volatilität durch die Verwendung höherer Zeitrahmen heraus und bestätigen ihre Analyse, bevor sie Kapital einsetzen.
Wann sollte man nach einem bärischen Signal ein- und aussteigen?
Die Ausführung eines Handels nach einem bärischen Signal erfordert das Abwarten eines bestätigten Schlusskurses unter dem Tief des Musters, um das Chance-Risiko-Verhältnis zu optimieren. Diese Bestätigungsregel stellt den mächtigsten Vorteil dar, der bärischen Muster-Tradern zur Verfügung steht; die Disziplin, auf eine Validierung zu warten, unterscheidet profitable Trader von jenen, die vorzeitig bei der Musterbildung einsteigen. Das Abwarten eines bestätigten Schlusskurses unter dem Tief des Musters ist genau das, was den Handel mit dem Muster vom Handel mit seiner bloßen Erwartung unterscheidet.
Die Identifizierung von „Bullen-Fallen“ unter Verwendung von Gravestone Dojis und Hanging Man-Mustern offenbart, wann scheinbare Umkehrungen eigentlich getarnte Fortsetzungs-Setups sind. Bullen-Fallen treten auf, wenn der Preis über ein Umkehrmuster steigt, sich aber sofort umkehrt, was bestätigt, dass der Ausbruch eine Fälschung war. Ausstiegsstrategien sollten frühere Unterstützungsniveaus als Gewinnmitnahmezonen nutzen, was es Tradern ermöglicht, einen Teil der Positionen auf vorbestimmten Niveaus zu schließen, anstatt durch anhaltende Umkehrungen zu halten, bei denen der emotionale Druck zunimmt.
Hanging Man bärische Umkehrung erklärt, wie diese Ein-Kerzen-Formation eine Trenderschöpfung an Hochs signalisiert, während Identifizierung eines Gravestone Doji die spezifische Mechanik von Doji-Formationen zeigt, die höhere Preise ablehnen. Kryptomärkte laufen rund um die Uhr und mit höherer Volatilität, daher braucht dieselbe Formation dort einen weiteren Stop und eine stärkere Volumenbestätigung als ihr Forex-Pendant.
Der Einstieg unmittelbar nach der Bildung eines Musters ohne Bestätigung macht das Signal deutlich unzuverlässiger als ein disziplinierter Einstieg. Widerstehen Sie dem psychologischen Drang, von frühem Momentum zu profitieren; Disziplin und Bestätigung bieten überlegene risikobereinigte Renditen.
Wissen in Gewinn verwandeln
Sie haben gelesen, jetzt ist es Zeit zu handeln. Der beste Weg zu lernen ist durch Praxis. Eröffnen Sie ein kostenloses, risikofreies Demokonto und üben Sie Ihre Strategie noch heute mit virtuellem Guthaben.
Kostenloses Demokonto eröffnenFortgeschrittene Techniken: Zeitrahmenfilterung und Volumenanalyse
Fortgeschrittene bärische Analysen identifizieren Umkehrungen mit hoher Wahrscheinlichkeit durch das Filtern von Mustern über H4- oder Tages-Zeitrahmen und institutionelle Volumenspitzen. Dass H4-Muster genauer sind als H1-Signale, spiegelt ein fundamentales Prinzip der technischen Analyse wider: Längere Zeitrahmen filtern das Rauschen heraus, das durch Privatanleger entsteht, die Intraday-Scalps ausführen. Institutionelle Trader operieren auf H4- und Tages-Zeitrahmen, was bedeutet, dass Volumenspitzen auf diesen Zeitrahmen echte Kapitalflüsse anzeigen und keine algorithmischen Mikro-Transaktionen.
„Three Black Crows“ (drei aufeinanderfolgende bärische Kerzen) identifiziert institutionelle Verteilung gegenüber Gewinnmitnahmen von Privatanlegern, indem sie anhaltenden Verkaufsdruck statt einer einzelnen Umkehrkerze zeigt. Die Kombination von Candlesticks mit RSI/MACD-Momentum bestätigt die Trendumkehr 2026, indem sie Divergenzen zwischen Preis und Momentum aufdeckt; wenn der Preis ein höheres Hoch macht, das Momentum dies aber nicht bestätigt, gewinnen bärische Candlestick-Muster zusätzliche Glaubwürdigkeit.
Den richtigen Zeitrahmen für Charts wählen erklärt, wie die Zeitrahmenwahl die Handelsergebnisse beeinflusst und demonstriert, warum höhere Zeitrahmen falsche Signale reduzieren. Bedeutung von Docht und Schatten beschreibt die Bedeutung oberer und unterer Dochte und erklärt, wie ausgedehnte Dochte Ablehnungsniveaus signalisieren, die zu Einstiegspunkten für nachfolgende Umkehrungen werden.
Wichtige Erkenntnisse
- Bärische Candlestick-Muster identifizieren Marktwendepunkte, an denen Verkäufer bei Preishöhepunkten die Käufer überwältigen.
- Das Evening Star-Muster gilt als das zuverlässigste bärische Umkehrsignal.
- Bestätigungseinstiege sind deutlich zuverlässiger als der Handel von Mustern unmittelbar nach Abschluss.
- Bearish Engulfing-Strategien werden deutlich zuverlässiger, wenn sie mit hohem relativem Volumen validiert werden.
- Muster in höheren Zeitrahmen (H4 und Tages-Charts) sind verlässlicher als Intraday-15-Minuten-Signale.
- Signale für institutionelle Verteilung wie ‚Three Black Crows‘ offenbaren groß angelegte Kapitalabflüsse aus einem Trend.
Häufig gestellte Fragen
Dieser Artikel enthält Verweise auf bärische Candlestick-Muster, Strategien der technischen Analyse und Volity, eine regulierte CFD-Handelsplattform. Dieser Inhalt wurde nur zu Bildungszwecken erstellt und stellt keine Finanzberatung oder Empfehlung zum Kauf oder Verkauf eines Finanzinstruments dar. Überprüfen Sie immer die aktuellen Marktbedingungen und Plattformdetails, bevor Sie handeln. Einige Links in diesem Artikel können Affiliate-Links sein.
Worauf unsere Analysten achten: Drei Filter, die die Gewinnraten bärischer Muster von einem Münzwurf zu einer wirklich informativen Basis heben. Standort des Musters relativ zum größeren Trend (eine bärische Umkehr bei einer Ablehnung des gleitenden Durchschnitts der letzten 200 Perioden ist ein anderes Setup als dasselbe Muster innerhalb einer Handelsspanne; der Standort ist die Hälfte des Signals). Volatilitätsregime zum Zeitpunkt der Bildung (Muster innerhalb von Perioden komprimierter Volatilität tragen engere Stops und klarere Folgebewegungen; die CBOE-Volatilitätsoberfläche ist die sauberste Live-Ablesung darüber, welches Regime aktiv ist). Bestätigungskadenz (das Abwarten des Schlusskurses der nächsten Kerze über das Muster hinaus ist der Unterschied zwischen dem Handeln des Musters und dem Handeln der Erwartung des Musters; der Bestätigungsfilter verbessert die Ergebnisse bei den wichtigsten Mustern in der Regel, um den Preis eines etwas späteren Einstiegs).
Volity betreibt eine Handelsplattform und veröffentlicht außerdem Bildungs- und Analyseinhalte zum Thema Trading. Die Inhalte dieser Seite dienen ausschließlich Bildungszwecken und sind nicht als Finanzberatung zu verstehen. Volity kann kommerziell profitieren, wenn Leser über Links auf dieser Website Handelskonten eröffnen.
Unsere Inhalte werden nach dokumentierten redaktionellen Standards erstellt und geprüft; siehe unsere Vergleichs- und Bewertungsmethodik.