Markets rise and fall, but price never moves in a straight line. Traders needed a way to measure how far prices might pull back before continuing in the same direction. This need gave rise to Fibonacci retracement in Forex—known as FIB.
Now, more traders rely on FIB levels to manage trades with precision. Instead of guessing, they follow specific price zones where reactions often occur. So, this shift creates a structured approach to trading trends.
While understanding Fibonacci Retracement is important, applying that knowledge is where the real growth happens. Create Your Free Forex Trading Account to practice with a free demo account and put your strategy to the test.
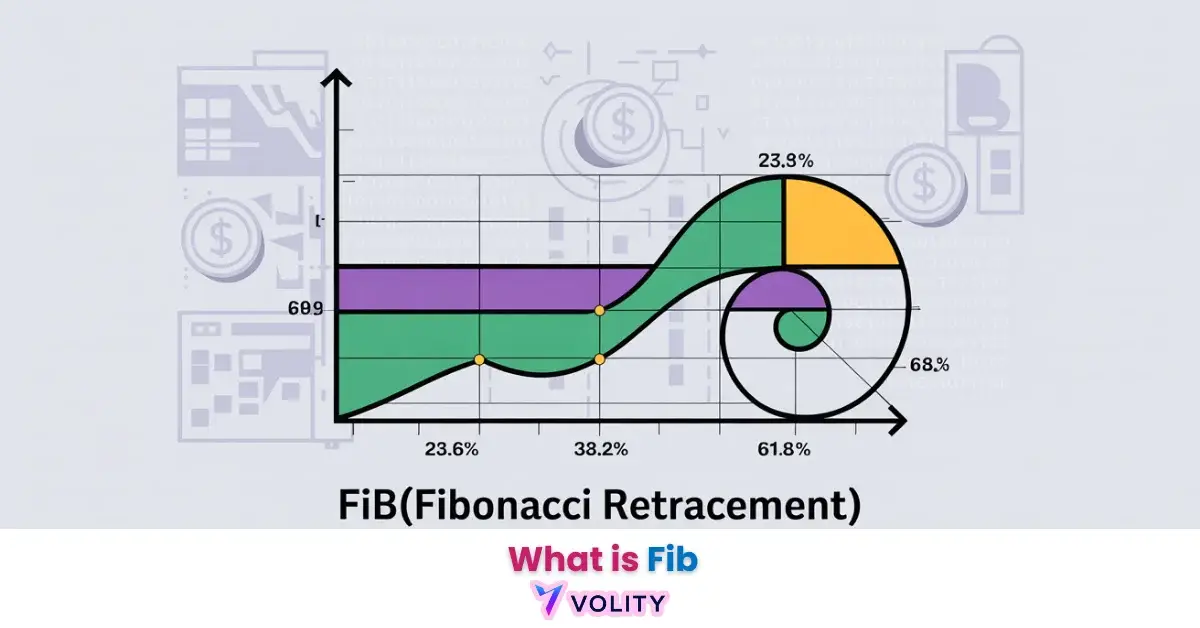
What is FIB in Forex?
In Forex trading, FIB stands for Fibonacci retracement. It is a technical tool traders use to measure how far the price might pull back after a strong move in the market. The tool helps you spot specific areas on the chart where the price could slow down, reverse, or prepare for the next move.
FIB divides a price move into smaller percentage zones. See, these are 23.6%, 38.2%, 50%, 61.8%, and 78.6%. Each level marks a possible point where buyers or sellers might step in again.
Take EUR/USD as an example. Suppose price moves from 1.0800 to 1.1200. That is a 400-pip rise. Using FIB, you can measure potential pullback zones. The 38.2% retracement sits around 1.1048, and the 61.8% retracement lands near 1.0952. These levels act as possible areas where traders look for price reactions. In an uptrend, buyers use FIB to spot where the price might pull back before climbing higher. In a downtrend, sellers watch for the price to bounce back up to a FIB level before dropping again.
Most trading platforms like MetaTrader, TradingView, or cTrader have a built-in Fibonacci retracement tool. You select the recent high and low, and the platform draws the levels for you on the chart. FIB works on all currency pairs and in all timeframes. Traders use it on EUR/USD, GBP/JPY, AUD/CAD, and others. It applies to daily charts, hourly charts, or even short-term setups.
How Does The Fibonacci Sequence Work?
Now, let’s break down how the Fibonacci sequence works in trading. This sequence starts with 0 and 1. Each number after that is the sum of the two before it. So, you get 0, 1, 1, 2, 3, 5, 8, 13, 21, 34, 55, 89, 144, and it keeps going (FOREX.com, 2025).
In fact, this pattern is not just random. It shows up in nature, architecture, and financial markets. Traders use the sequence because it creates ratios that help measure pullbacks in price action (Dukascopy, 2024). Let’s focus on how the ratios form. So, start by dividing a number in the sequence by the next one. The result is about 0.618, or 61.8%. This is called the golden ratio, and traders rely on it to spot possible trend continuation points.
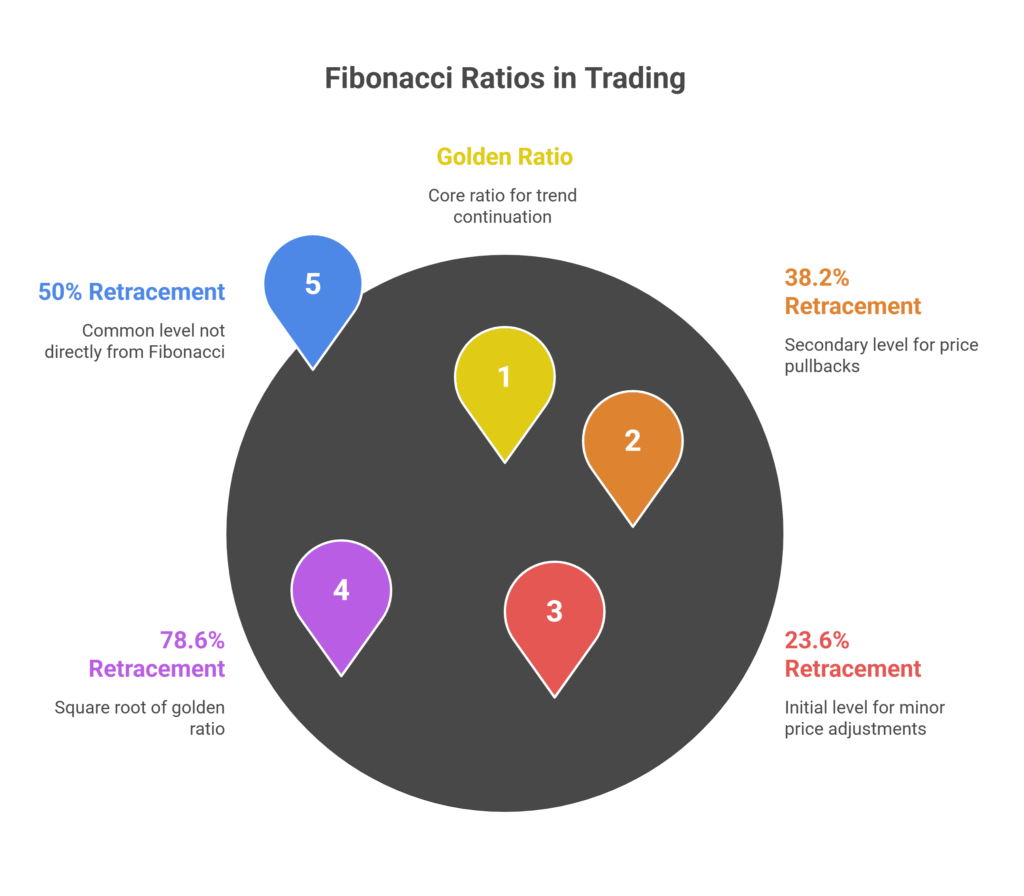
So, there are other important levels:
- 38.2% forms by dividing a number by the one two places ahead.
- 23.6% forms by dividing a number by the one three places ahead.
- 78.6% comes from taking the square root of 61.8% (FOREX.com, 2025).
See how this fits into trading? These percentages become retracement levels. Traders use them to measure how far prices might pull back after a strong move.
Moreover, the 50% level often appears in trading plans. It does not come from the Fibonacci sequence directly, but traders use it because markets often retrace half of a previous move before continuing. That’s why the 50% retracement is included in most Fibonacci tools (Blueberry Markets, 2024).
Now, you can understand why Fibonacci ratios matter. They help traders mark out possible reaction zones on the chart. Price tends to respond to these levels because many traders use the same reference points, creating consistent market behavior (Investopedia, 2025).
Ready to Elevate Your Trading?
You have the information. Now, get the platform. Join thousands of successful traders who use Volity for its powerful tools, fast execution, and dedicated support.
Create Your Account in Under 3 MinutesHow to Use Fibonacci Retracement for Trading?
According to BabyPips (2024), Fibonacci ratios mark specific levels where price could retrace before continuing a trend. Traders use these levels to identify possible support and resistance zones during corrections. Investopedia (2025) explains the method clearly. Traders select a swing high and a swing low on the chart. The Fibonacci tool then plots retracement levels at 23.6%, 38.2%, 50%, 61.8%, and 78.6% of the previous move.
In an uptrend, traders expect the price to pull back to one of these levels before moving higher. In a downtrend, traders expect the price to bounce to a Fibonacci level before dropping again. This approach helps structure trade entries and exits. Based on FOREX.com (2025), the 61.8% level often acts as a strong turning point in the market. Many traders plan trades around this level because of its connection to the golden ratio.
Blueberry Markets (2024) adds that traders set stop-loss orders just beyond the next Fibonacci level to manage risk. For instance, a buy order near 38.2% often uses a stop below 50%.
What’s a Real-time Example of FIB in Action?
Let’s look at a real FIB setup in the EUR/USD market. According to Blueberry Markets (2024), suppose the price moves from 1.0800 to 1.1200. it creates a 400-pip upward move. Traders then expect a possible pullback before the trend continues. The Fibonacci tool marks the retracement levels between these two points. Based on the standard calculation:
- 23.6% level: 1.1105
- 38.2% level: 1.1048
- 50.0% level: 1.1000
- 61.8% level: 1.0952
- 78.6% level: 1.0888
So, in this scenario, traders watch for the price to drop to one of these levels. Suppose price pulls back to 1.1048, which is the 38.2% retracement. If bullish signals appear there, traders may enter a buy trade aiming for a return to 1.1200 or beyond.
Based on Investopedia (2025), stop-loss orders usually sit just below the next level, so in this case, under 1.1000. For profit-taking, traders may use a 161.8% extension, placing a target near 1.1448. This approach shows how FIB levels create a structured trading plan using real price data and reaction points from previous market moves.
What Are Some Advanced FIB Strategies?
Based on Blueberry Markets (2024), advanced traders use the Fibonacci Flush Strategy to combine multiple timeframes. They mark retracements on the 60-minute chart for intraday entries and use daily or weekly charts to confirm larger trend levels.
This method filters out weak signals. Another method is the Parabola Pop Strategy, also explained by Blueberry Markets (2024). Traders track breakouts above or below FIB retracement zones to catch early trend continuations. This works well for longer-term setups using monthly and weekly charts.
According to Dukascopy (2024), traders combine FIB with trendlines, moving averages, or candlestick patterns for stronger confirmations. For instance, a bullish engulfing pattern near the 61.8% level signals a potential buy setup.
Investopedia (2025) highlights the use of Fibonacci extensions after a retracement. Traders first measure the pullback using standard FIB levels, then project profit targets using 161.8% or 261.8% extensions.
Moreover, traders align FIB levels with Elliott Wave Theory counts or harmonic patterns like the Gartley pattern. In fact, this adds precision to entry and exit timing in complex market structures.
Pros and Cons of Using FIB
| Pros | Cons |
| Identifies clear support and resistance levels | No guarantee price will respect the levels |
| Works across all timeframes and currency pairs | Requires correct swing high and low selection |
| Helps plan entries, stops, and profit targets systematically | Can produce false signals in choppy markets |
| Combines well with other technical tools | Becomes subjective if used without confirmation |
| Reduces emotional decision-making | Works better in trending conditions; less effective in ranges |
Common Fibonacci Mistakes in Forex Trading
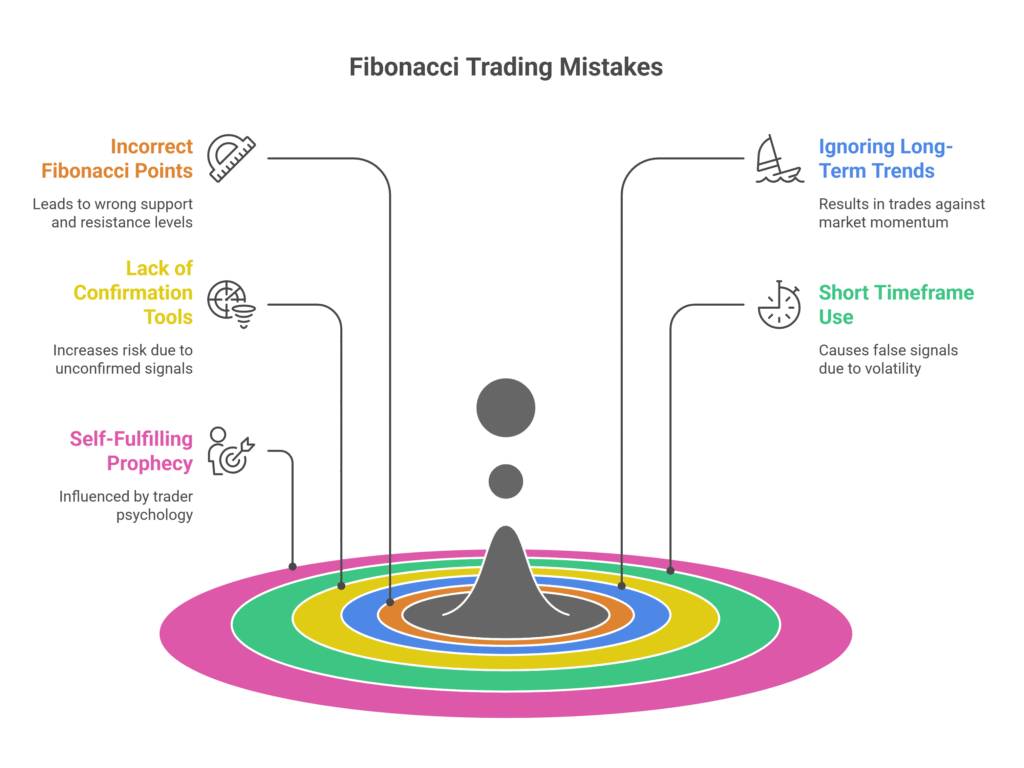
According to Investopedia (2022), here are the most common mistakes traders make when using Fibonacci retracements in forex:
- Mixing candle wicks and bodies when setting Fibonacci points causes wrong support and resistance levels.
- Ignoring long-term trends leads to short-term trades that go against the market’s momentum.
- Relying on Fibonacci alone without using confirmation tools like MACD or stochastic indicators increases risk. Many traders validate retracements by combining Fibonacci + Bollinger, which helps confirm whether price reactions have real momentum.
- Using Fibonacci on short timeframes leads to false signals due to volatility and market noise.
- Fibonacci works better on long-term charts because they provide stronger data for analysis.
- Fibonacci retracements help spot potential turning points but need careful and consistent application.
- The method is sometimes criticized as a self-fulfilling prophecy influenced by trader psychology.
Turn Knowledge into Profit
You've done the reading, now it's time to act. The best way to learn is by doing. Open a free, no-risk demo account and practice your strategy with virtual funds today.
Open a Free Demo AccountFinal Thoughts
Now, FIB shows traders exact price levels where the market may pause or reverse. It removes guesswork from trade decisions. In fact, the tool sets clear plans for entries, stops, and targets. Each level creates a reference point for action. Moreover, a candlestick pattern near a FIB level provides a stronger reason to enter. A trendline that matches a retracement level confirms the setup further.
A trader who follows FIB develops discipline. This method builds consistency and keeps the focus sharp in every market condition.