There’s a way for forex traders to trade with structure instead of guesswork. A way to map out where price may turn, pause, or push through—before the market even opens. Yes, pivot points. You can use pivot points to spot pressure zones, plan cleaner entries, and avoid reacting late.
Let’s discuss pivot points in detail so you know how to trade smartly with clear intent at each level.
While understanding Pivot Point in Forex is important, applying that knowledge is where the real growth happens. Create Your Free Forex Trading Account to practice with a free demo account and put your strategy to the test.
What Are Pivot Points in Forex?
Pivot points are price levels that help you identify potential support and resistance zones during a trading session. They are calculated using the previous day’s high, low, and closing prices. In forex, where the market runs 24 hours, traders often use the New York close to define the “previous day.”
Basically, pivot points show where price may shift direction. If price trades above the pivot point, it signals a bullish bias. If it trades below, it reflects a bearish bias. That pivot becomes the anchor for six additional levels—three supports (S1, S2, S3) and three resistances (R1, R2, R3)—which traders use to anticipate price reactions.
For example, if EUR/USD is approaching R1 from below, traders watch for signs of reversal or breakout. See, these levels guide entry, exit, and stop-loss decisions, especially in short-term strategies.
So, it is safe to say that points simplify key decisions without requiring complex indicators. You get a quick read on the market’s mood and likely reaction points—directly from price itself.
What Do S1, S2, S3 and R1, R2, R3 Mean in Pivot Points?
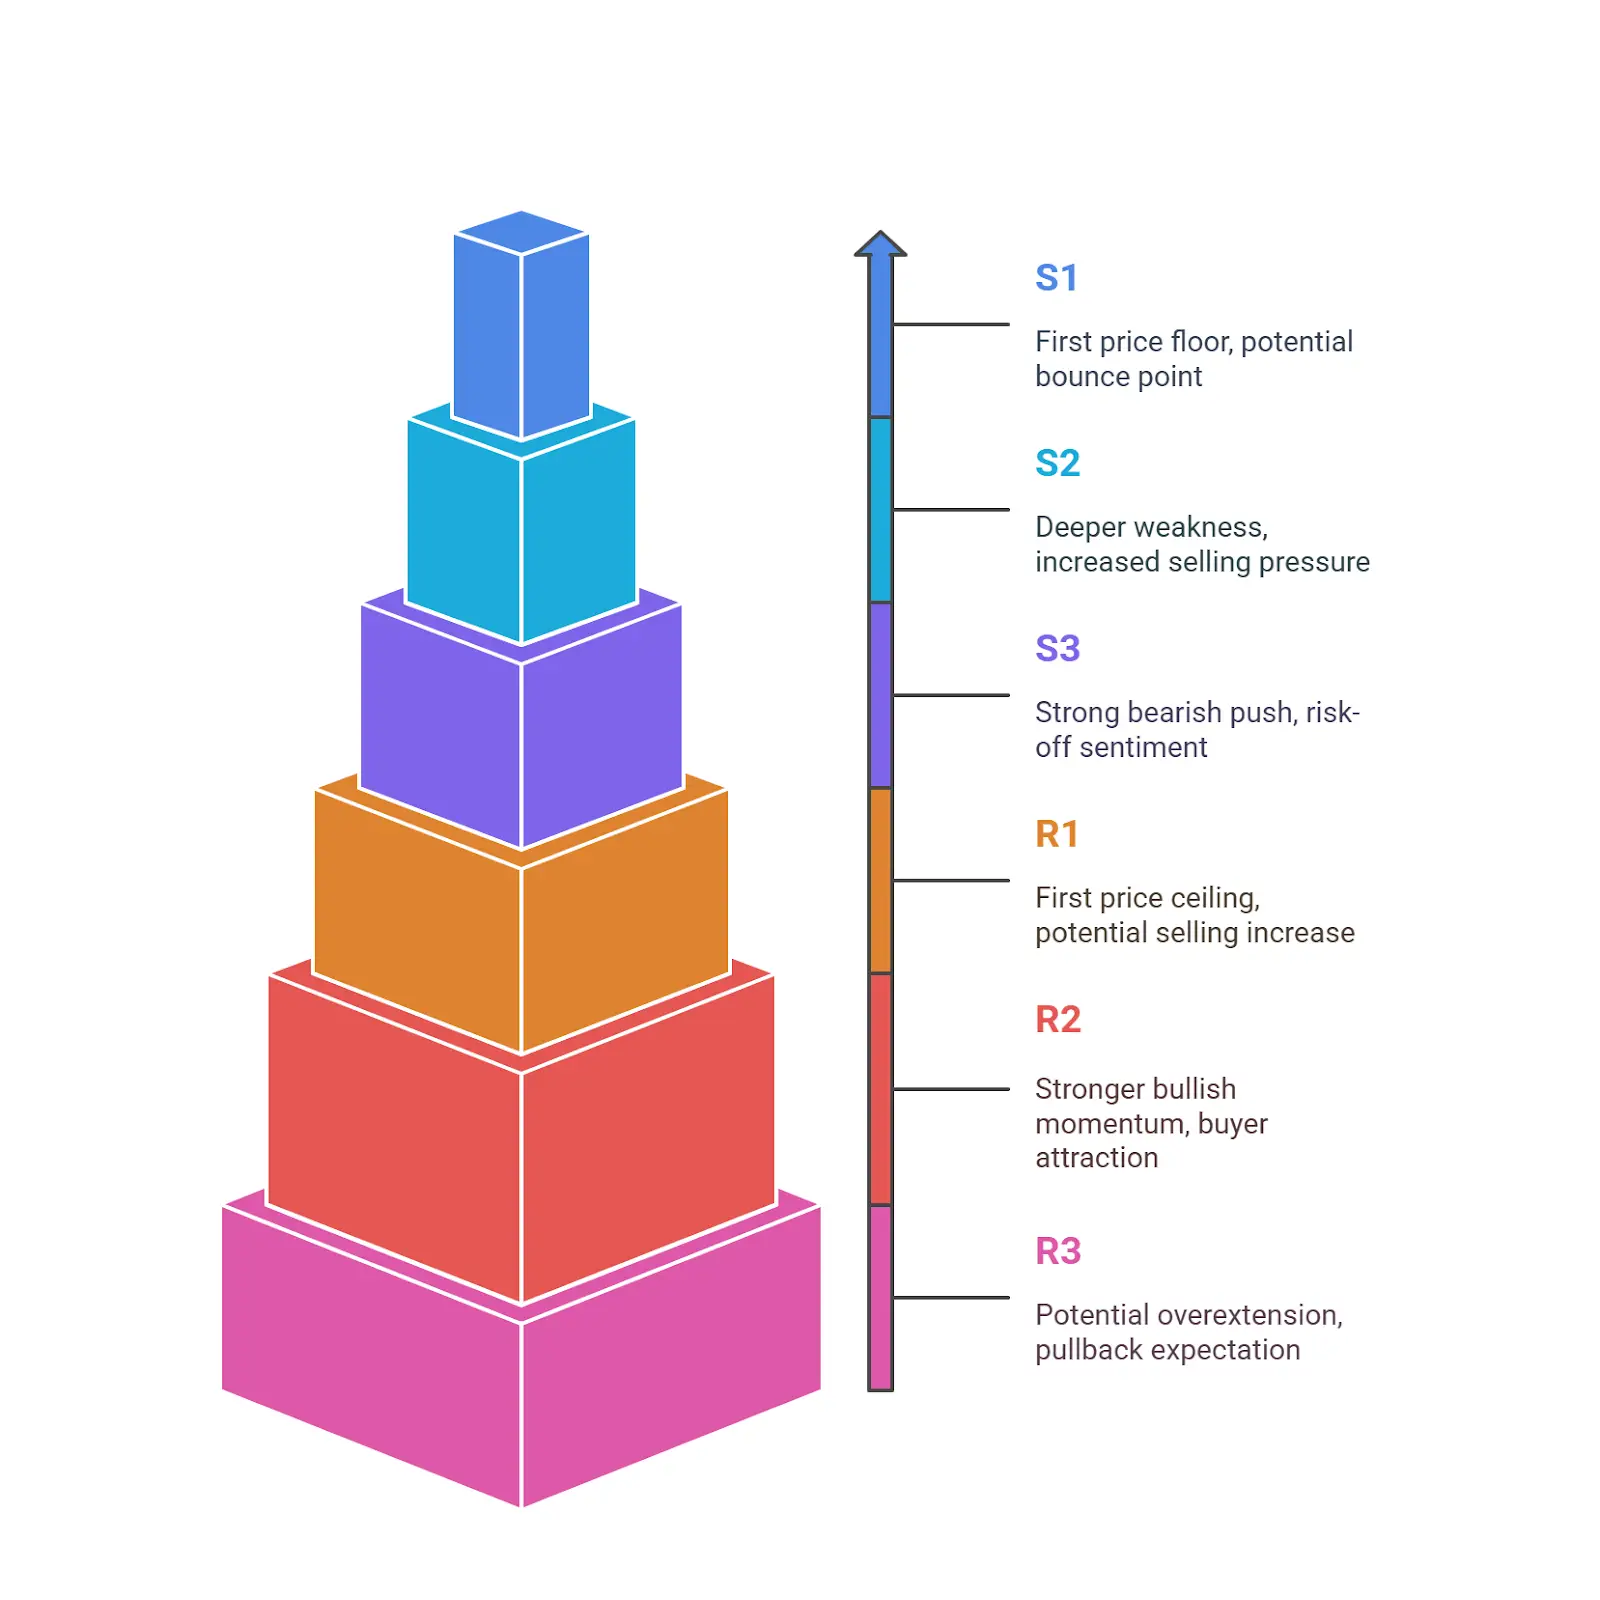
S1, S2, and S3 stand for three levels of support below the main pivot point. R1, R2, and R3 represent three resistance levels above it. Each level acts as a reference for potential price reactions during the trading session.
Support Levels:
- S1 often marks the first price floor. If price tests S1 and holds, a bounce is likely.
- S2 shows deeper weakness. A drop toward S2 signals increased selling pressure.
- S3 reflects a strong bearish push. If price reaches S3, sentiment is heavily risk-off.
Resistance Levels:
- R1 is the first price ceiling. If price hits R1 and stalls, selling may increase.
- R2 points to stronger bullish momentum. Breakouts above R2 attract more buyers.
- R3 signals potential overextension. When price hits R3, traders often expect a pullback.
Each level also helps traders plan:
- Entry and exit points
- Stop-loss or take-profit zones
- Expected volatility bands
For example, if EUR/USD trades below the pivot but hovers near S1, short-sellers may wait for a break below S1 to confirm bearish strength. Others may buy expecting a bounce. The role of each level depends on price flow, volume, and the time of day.
But remember that S and R levels don’t guarantee reversals as they simply guide the structure. The stronger the reaction near a level, the more likely it plays a role in future price moves.
Ready to Elevate Your Trading?
You have the information. Now, get the platform. Join thousands of successful traders who use Volity for its powerful tools, fast execution, and dedicated support.
Create Your Account in Under 3 MinutesHow Are Pivot Points Calculated?
Pivot points are calculated using a basic formula that relies on the previous period’s high, low, and close. In forex trading, the most common approach uses daily data based on the 24-hour cycle ending at the New York close.
Here’s how each level is calculated:
Main Pivot Point (P):
P=(High+Low+Close)3P = frac{(High + Low + Close)}{3}P=3(High+Low+Close)
This acts as the central level around which support and resistance zones form.
Support Levels:
- S1 = (2 × P) − High
- S2 = P − (R1 − S1)
- S3 = P − (R2 − S2)
Resistance Levels:
- R1 = (2 × P) − Low
- R2 = P + (R1 − S1)
- R3 = P + (R2 − S2)
It is worth noting that each level builds on the main pivot and reflects how much price may stretch or reverse within a session. Many platforms calculate these levels automatically, but understanding the math allows for better precision when adapting to different timeframes (hourly, daily, weekly).
In fact, some traders also use alternative methods like Fibonacci, Woodie’s, or Camarilla pivot formulas. Still, the classic method remains most widely used in forex day trading due to its simplicity and effectiveness across pairs like EUR/USD or GBP/JPY. If you want a step-by-step breakdown of how pivot levels are calculated, you can explore the detailed formulas.
What Do Pivot Points Signal in Trading Sessions?
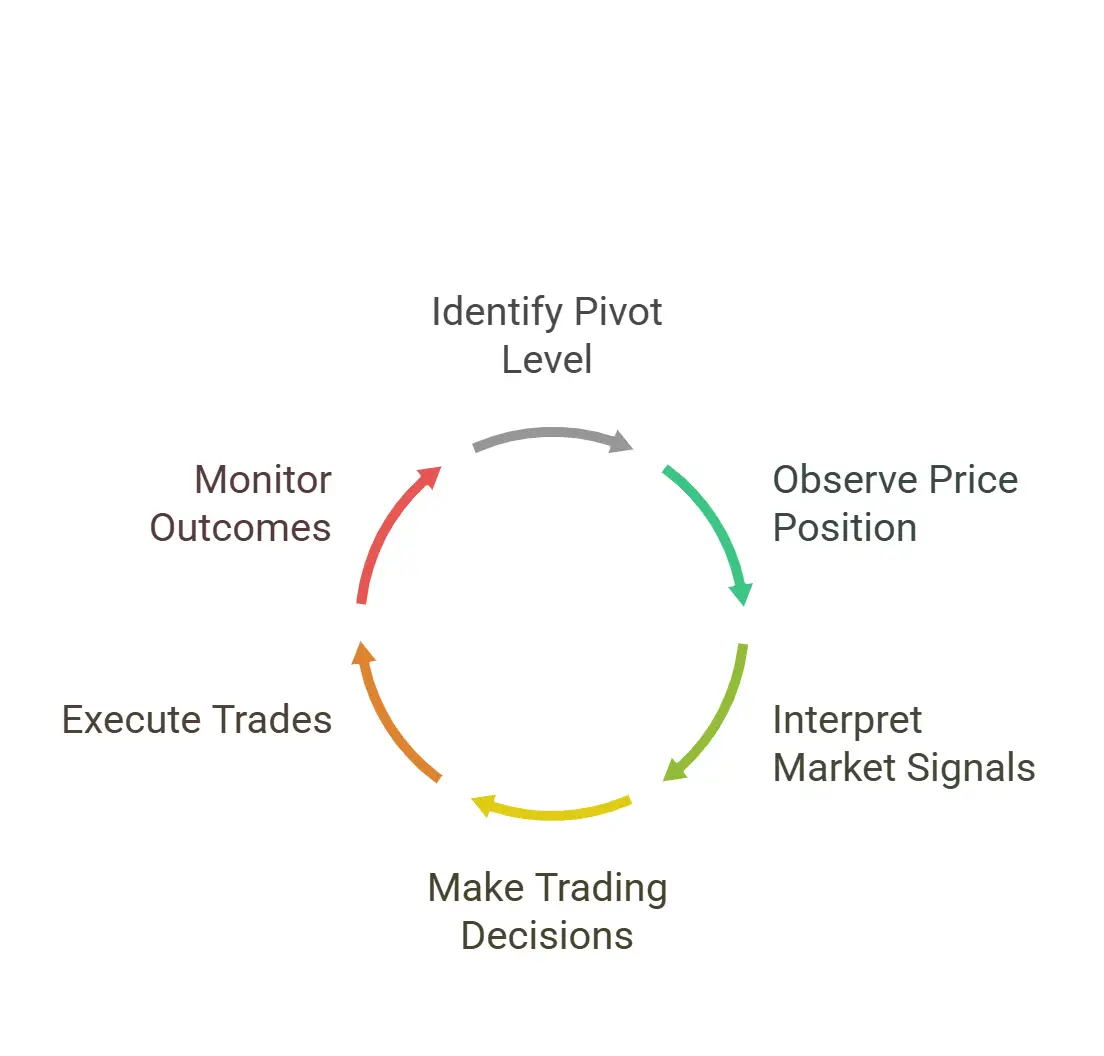
Pivot points guide your view of market momentum. Let’s say you open a EUR/USD chart. Price starts above the pivot and moves steadily toward R1. That upward push shows early buyer strength. You may decide to follow the move, placing your target near R2.
Now look at USD/JPY. Price opens below the pivot and drops toward S1. Sellers now lead. Once price touches S1, you can watch for two things. If it continues lower, S2 becomes a clear target. If it turns back toward the pivot, a reversal setup forms.
Use each level as a decision zone:
- Above pivot? Buyers set the tone.
- Below pivot? Sellers hold control.
- Near the pivot? The market prepares to decide direction.
Each session gives you fresh signals. There’s no need to wait for a chance. You track where price stands relative to pivot levels. That’s how you stay aligned with the day’s flow.
How to Use Pivot Points in Forex Strategy?
Pivot points help you set clear trade levels before the session begins. You can use them to place entries, set targets, and manage risk with structure.
Let’s say EUR/USD opens below the pivot and starts rising. You expect it to retest the pivot, so you place a short entry at the pivot with a stop just above R1. If price turns down, you aim for S1 as your target. That’s a simple pivot-reversal strategy.
Now consider GBP/JPY trading above the pivot. Price pulls back near the pivot but holds firm. You go long from the bounce with R1 as your target and the pivot as your stop. In this case, the pivot acts as a trend-confirmation level.
You can also trade breakouts. If price surges above R1 with strong momentum, you enter long and target R2. Volume or RSI confirmation helps validate the move.
The most effective use happens when pivot levels align with prior highs, lows, or Fibonacci zones. That’s when support and resistance grow stronger.
Combine pivot points with indicators like moving averages or MACD to filter direction. You trade what’s aligned. You exit what’s unclear.
Each setup—reversal, bounce, or breakout—gains clarity once you place it in context of the day’s pivot map. The goal is not to chase every line. The goal is to read what traders may respect.
Classic vs Fibonacci vs Camarilla: Which Pivot Point Method Works Best?
| Method | Calculation Basis | Support/Resistance Levels | Best Use Case | Strengths | Weaknesses |
| Classic | High + Low + Close ÷ 3 | S1, S2, S3 and R1, R2, R3 | Day trading with stable volatility | Simple and widely used | May lack precision in volatile moves |
| Fibonacci | Uses Fibonacci ratios on High, Low, Close | S1-S3 and R1-R3 based on Fibonacci retracements | When market respects Fibonacci zones | Balances precision with trend structure | Can overfit price if market is choppy |
| Camarilla | Focuses on Close, High, and Low with unique formula | S1-S4 and R1-R4; tighter near price, good for reversals | Scalping or reversal trades in volatile markets | Fast-reacting, tight zones ideal for quick trades | Not ideal for trend-following setups |
How to Combine Pivot Points With Other Indicators?
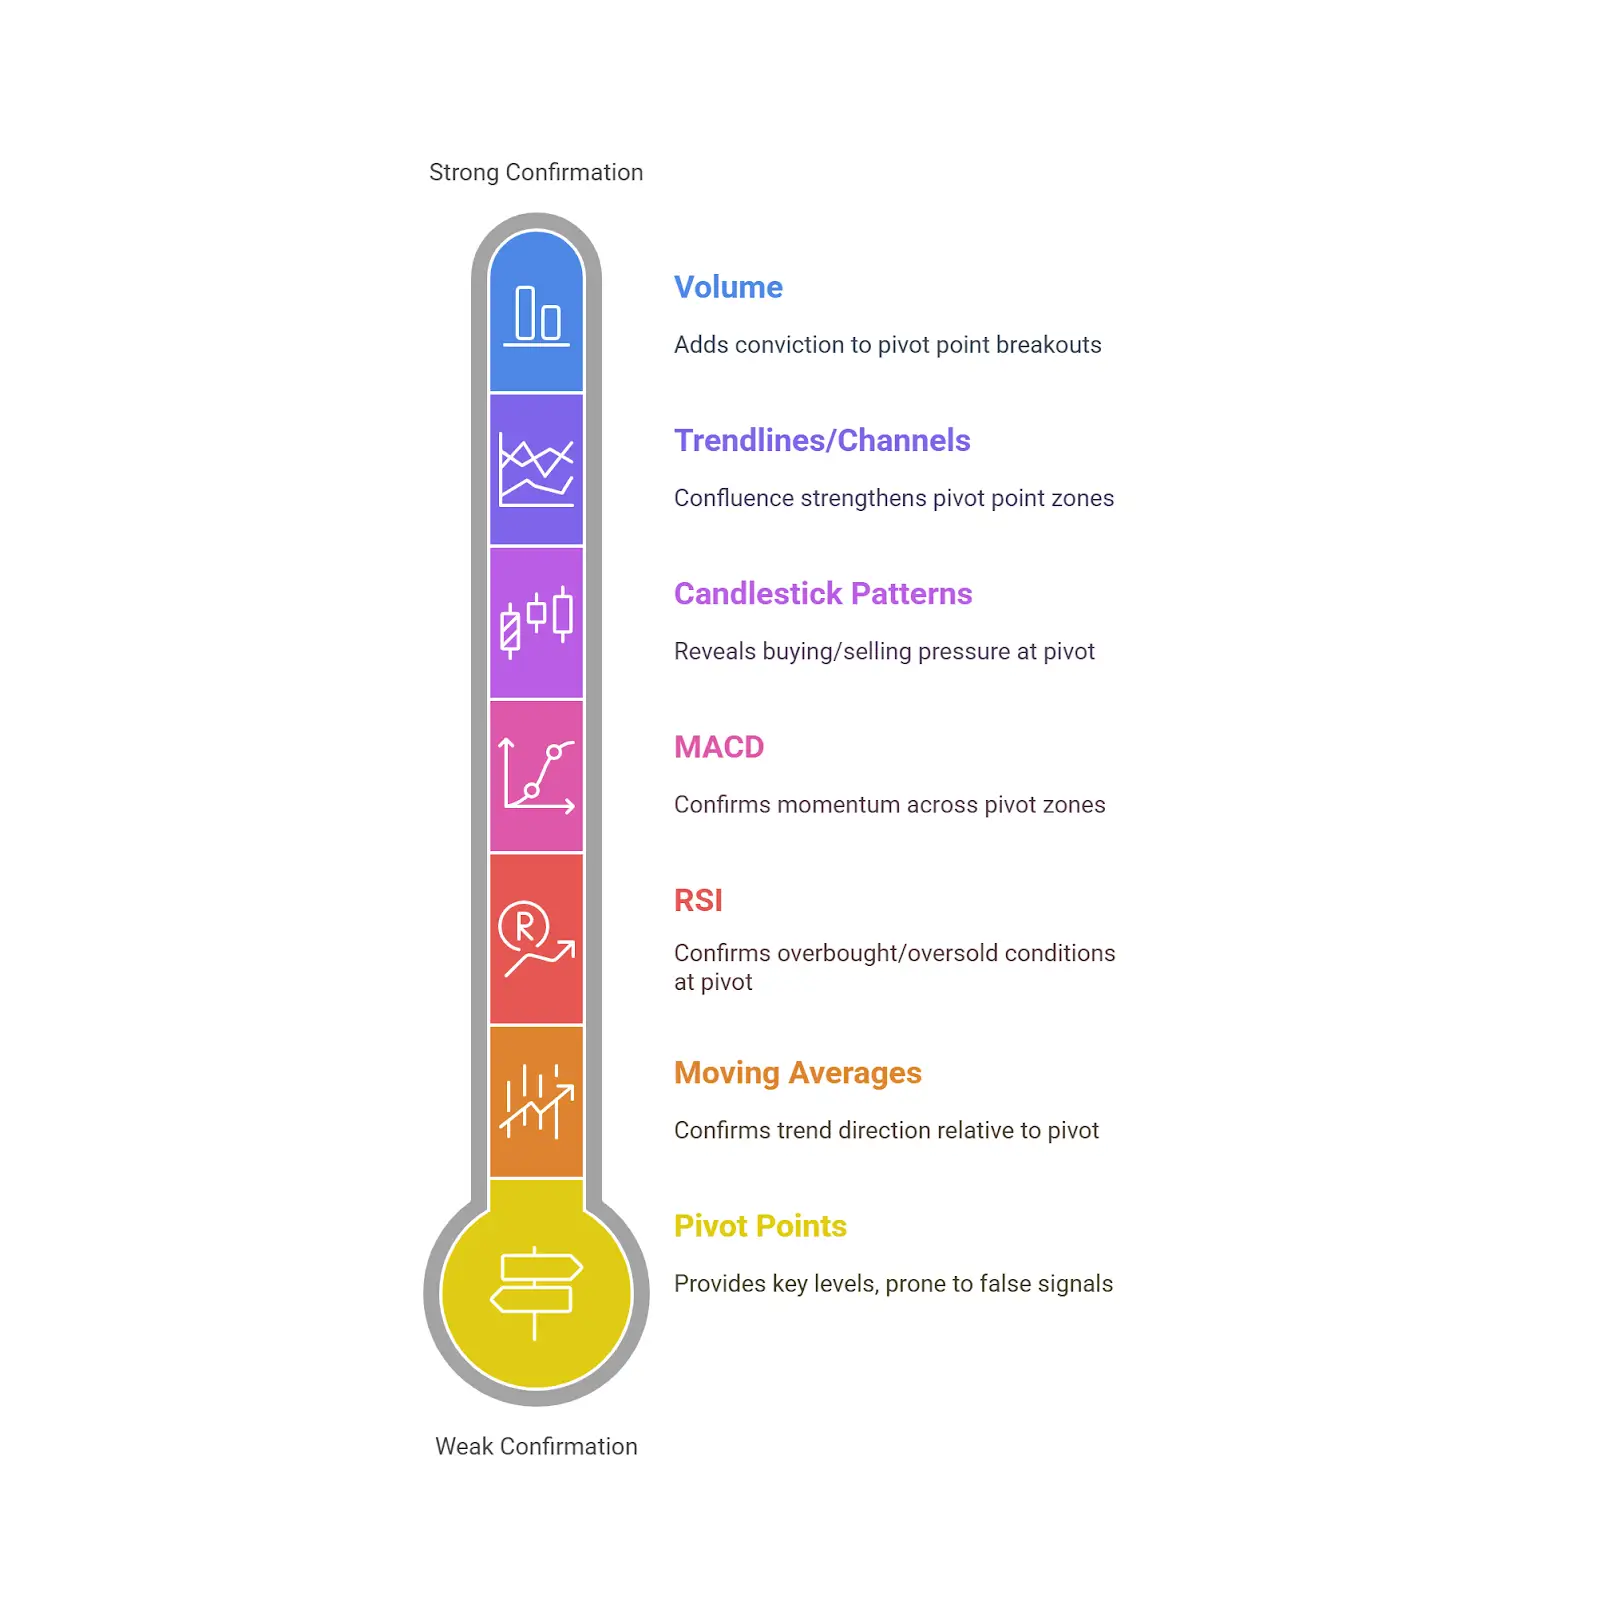
Pivot points give you key levels. But when used alone, they may lead to false signals in volatile markets. Therefore, many traders combine pivot levels with other Forex indicators to confirm trend direction and improve accuracy.
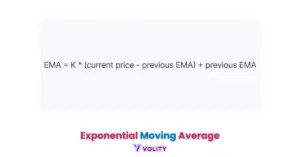
1. Moving Averages (MA)
Use a 50-period or 200-period moving average to confirm the trend.
- If price stays above both the moving average and pivot, look for long trades toward R1 or R2.
- If price stays below both, focus on shorts targeting S1 or S2.
2. RSI (Relative Strength Index)
RSI confirms whether price is overbought or oversold at a pivot level.
- Example: RSI below 30 as price hits S1 can suggest a bounce.
- RSI above 70 near R2 may signal a pullback or reversal.
3. MACD (Moving Average Convergence Divergence)
MACD helps you confirm momentum across pivot zones.
- If MACD crosses above the signal line near the pivot or R1, trend may gain strength.
- A bearish crossover near S1 or S2 warns of extended downside.
4. Candlestick Patterns
Watch how candles behave at pivot levels.
- A bullish engulfing at S1 supports a buy setup.
- A shooting star near R2 could warn of selling pressure.
5. Trendlines or Channels
When trendlines intersect pivot levels, the confluence creates stronger zones.
- Price bouncing from a rising trendline at S1 often signals a strong entry point.
- A break below a descending trendline at S2 may trigger momentum selling.
6. Volume
Higher volume at pivot breakout adds conviction. For instance, price breaking above R1 with rising volume often confirms strong upside.
So, it is clear that pivot points act like road signs. When you align them with tools like RSI, MACD, or moving averages, your trade setups become sharper, cleaner, and more reliable.
Benefits and Limits of Pivot Points in Forex
| Benefits | Limits |
| Easy to calculate using previous session’s data | May produce false signals in highly volatile markets |
| Provides clear support and resistance zones | Not always accurate in trending markets |
| Helps assess daily market sentiment | Depends heavily on the previous day’s price action |
| Works well for day traders and short-term setups | Does not account for macroeconomic or news events |
| Integrates easily with other technical indicators | Requires confirmation from other tools to increase reliability |
Common Misconceptions About Pivot Point Trading
- Every pivot level leads to a market reaction
- S1 to S3 and R1 to R3 are equally strong
- Pivot points work without confirmation from other tools
- Pivot levels suit all timeframes the same way
- Previous day’s data always reflects current market behavior
- Pivot points only signal reversals not trend continuation
- One pivot method works best in all situations
Turn Knowledge into Profit
You've done the reading, now it's time to act. The best way to learn is by doing. Open a free, no-risk demo account and practice your strategy with virtual funds today.
Open a Free Demo AccountFinal Words
Pivot points in Forex create a price framework to help you decide whether to hold, enter, or exit based on how price reacts around expected levels. You don’t need to guess the direction. Instead, you respond to structure.
Each session offers a fresh setup. You track how the market opens, how far it moves, and where pressure builds. Some levels get tested, others break. With time, you start seeing patterns—where momentum fades or where reversals take shape.
Build your strategy around all these reactions. Test different pivot methods. Use confirmations. In fast markets, structure matters—and pivot points help you trade with it, not against it.