Your trading account doesn’t care about predictions or opinions. It only reflects one thing—P/L, your profit and loss. Every trader checks the numbers, but very few understand what those numbers actually mean for long-term success.
So, let’s make it simpler.
This guide walks you through P/L calculation, risk control, and strategy refinement the way professional traders do it. You’ll learn the exact steps to track daily results, overall performance, and real account growth.
Are you ready to trade like a pro? Let’s start with the basics that most traders overlook—the true meaning of P/L.
While understanding P/L Meaning in Forex is important, applying that knowledge is where the real growth happens. Create Your Free Forex Trading Account to practice with a free demo account and put your strategy to the test.
What Does P/L Mean in Forex?
The term P/L refers to Profit and Loss. It tells you how much money your trades are generating or losing at any given moment.
A trading account shows P/L for each position. However, professional traders never depend on platform numbers alone. Full control of your trading balance requires knowing how P/L works because your account equity changes every second based on price movements.
The link between P/L and margin matters more than many beginners realize. Positive P/L increases available margin. Negative P/L reduces it. When margin falls too low, brokers initiate stop-outs or margin calls. According to Investopedia’s 2024 Forex P/L Guide, every open trade updates in real time based on live bid and ask prices.
P/L in forex comes in two types:
- Realized P/L records the outcome of closed trades.
- Unrealized P/L, also called unrealized profit and loss, tracks the profit or loss on open trades using live market prices.
What is the Difference Between Unrealized and Realized P/L?
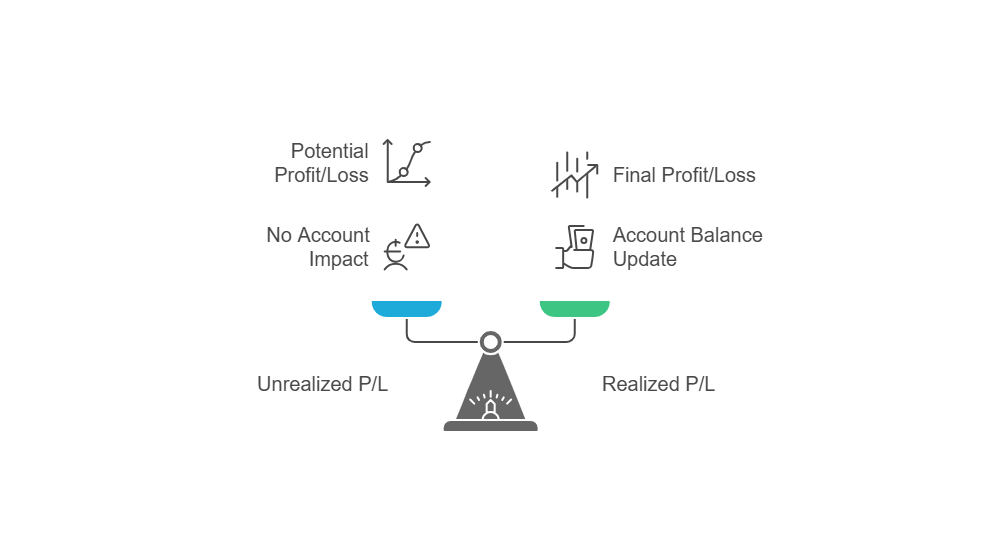
Now it must be clear that forex trading deals with two types of P/L—Realized P/L and Unrealized P/L. Every trader needs to understand the difference because your account balance and future risk depend on it.
Unrealized P/L (Floating P/L)
Your Unrealized P/L, also called Floating P/L, shows the profit or loss of your currently open trades. The market moves up and down, so your floating P/L changes in real time. It reflects what would happen if you closed the trade right now.
| Position | Entry Price | Current Price | Pips | Result |
| Long EUR/USD 10,000 units | 1.15000 | 1.13000 | -200 pips | Floating Loss: -$200 |
| Long EUR/USD 10,000 units | 1.15000 | 1.16000 | +100 pips | Floating Profit: +$100 |
Each pip in a mini lot equals $1. So, a 200-pip drop creates a floating loss of $200, while a 100-pip rise gives you a floating profit of $100. But none of this is final until you close the position.
Traders often fall into a trap here. You might see an unrealized profit, feel confident, and let it float—only to watch it turn into a loss. Or you might hesitate to close a losing trade, hoping for a reversal, and end up with an even bigger drawdown and P&L, which shows how floating losses accumulate into account stress.
Realized P/L
Realized P/L becomes real the moment you close the trade. Your account balance updates, and the profit or loss moves from “paper” to cash.
| Scenario | Balance Before | P/L | Balance After |
| Realized Profit | $1,000 | +$100 | $1,100 |
| Realized Loss | $1,000 | -$200 | $800 |
Once you close the trade, no market movement can change the result. The gain or loss is locked into your account balance.
Every professional trader treats Unrealized P/L as potential and Realized P/L as final. See, such a mindset prevents mistakes. Emotional traders often celebrate too early or hold onto losses too long because they confuse floating numbers with real gains.
Ready to Elevate Your Trading?
You have the information. Now, get the platform. Join thousands of successful traders who use Volity for its powerful tools, fast execution, and dedicated support.
Create Your Account in Under 3 MinutesWhy Should You Track Profit and Loss in Forex Trading?
According to Investopedia’s forex trading guide (2025), traders who ignore P/L often lose control of both risk and results. So, disciplined traders treat P/L tracking as a core part of their daily routine—not an afterthought.
More clearly, it is important to track profit and loss statements in Forex trading because:
- Account balance control comes from real-time P/L awareness and understanding equity vs P&L, since equity reflects how live results shape balance.
- Risk exposure management depends on watching floating P/L closely.
- Performance evaluation requires consistent tracking of wins and losses.
- Emotional discipline improves when P/L removes guesswork from decisions.
- Strategy adjustments become possible after reviewing P/L patterns.
- Trading plan compliance depends on respecting loss limits and profit targets.
- Margin management requires close monitoring of unrealized P/L.
- Tax reporting and financial records rely on realized P/L data.
How to Calculate P/L on a Forex Trade?
Okay, so every professional trader needs to calculate profit and loss manually—not just rely on the platform. Trading software shows P/L automatically, but real control starts when you understand the math behind each trade. Without this knowledge, you cannot size trades properly or manage risk confidently.
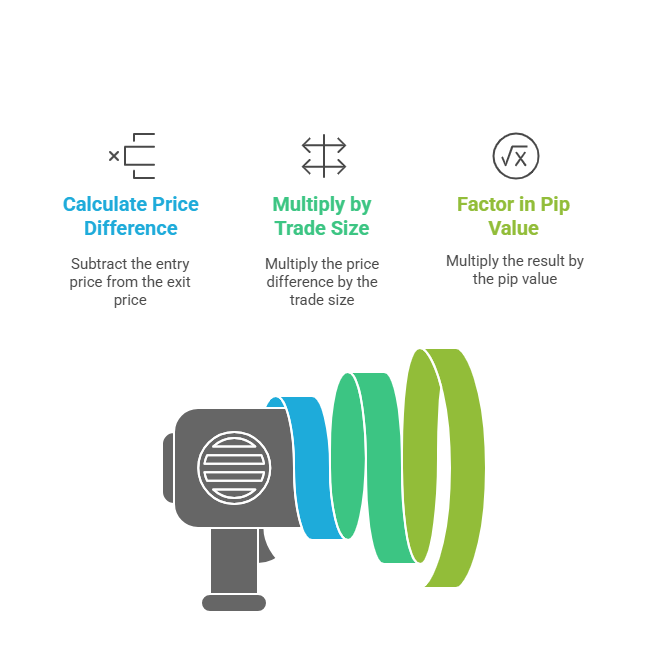
The basic formula stays simple:
P/L = (Exit Price – Entry Price) × Trade Size × Pip Value
So, the next step is to look at examples and see how this works in real conditions.
Suppose you buy EUR/USD at 1.1000 and close the trade at 1.1050. That move gives you 50 pips in profit. For 1 standard lot (100,000 units), each pip equals $10. So the calculation looks like this:
P/L = (1.1050 – 1.1000) × 100,000 × 0.0001 = 50 pips × $10 = $500 profit
The same rule applies when you sell instead of buy. Suppose you short GBP/USD at 1.2500 and close at 1.2450. The price drops 50 pips, which gives you a profit because you sold high and bought back low. For 1 standard lot, the pip value is again $10, so the result is:
P/L = (1.2500 – 1.2450) × 100,000 × 0.0001 = 50 pips × $10 = $500 profit
So, what happens when the market moves against you?
Suppose you buy USD/JPY at 110.00 and close at 109.50. That’s a 50 pip loss. For USD/JPY, the pip value is usually $9.09 per standard lot because the quote currency is JPY, and you need to convert it into USD. The formula becomes:
P/L = (109.50 – 110.00) × 100,000 × 0.01 = -50 pips × $9.09 = -$454.50 loss
Forex also involves currency conversion in some pairs. Suppose you trade USD/CHF and make CHF 100 profit. You must convert that profit to USD for margin and balance purposes. If the exchange rate is 0.8500, the conversion looks like this:
CHF 100 ÷ 0.8500 = $117.65 profit in USD
So, tracking your P/L in forex means more than just simply keeping a check on platform numbers. If you know how to calculate profit and loss manually, it prepares you for margin management, position sizing, and risk control. Ultimately, your trading career depends on this knowledge because it protects you from hidden risks and sharpens your decision-making in every market condition.
Why Does Pip Value Matter in P/L Calculations?
It should be clear that every forex trade depends on pip movement. But pip size alone does not tell you how much money you gain or lose. The real number that affects your account is the pip value. That’s why you must calculate it correctly before opening any position.
Pip value shows the exact dollar amount you earn or lose for each pip the market moves. Without knowing the pip value, you cannot manage trade size or risk properly. Basically, pip value changes based on the currency pair, lot size, and the account’s base currency.
Let’s break this down through examples.
Suppose you trade EUR/USD. For a standard lot (100,000 units), each pip equals $10. So, a 10 pip movement equals a $100 profit or loss.
Now consider a mini lot (10,000 units). Each pip equals $1 in this case. So, the same 10 pip move gives a $10 result instead.
Different currency pairs have different pip values. Suppose you trade USD/JPY. Since JPY is the quote currency, each pip represents 0.01 instead of 0.0001. For a standard lot, the pip value is usually $9.09, not $10. That difference matters because it changes your potential gain or loss on every trade.
Currency conversion also affects pip value. When you trade pairs like GBP/JPY or EUR/CHF, pip values must convert back to your account currency—usually USD. That’s why platforms calculate pip value dynamically for each trade.
So, pip value matters because it controls how much you risk per trade.
How Do Swap, Spread, and Commission Affect Your Net Profit and Loss?
Every trade includes three unavoidable costs: spread, commission, and swap. Each one subtracts from gross profit or adds to the loss.
According to FXCM’s execution model, traders who ignore these costs often overestimate their real returns.
Here’s how each cost impacts your trade:
- Spread creates an immediate cost the moment you open a trade.
- Commission charges apply per lot and reduce profit directly.
- Swap fees deduct overnight interest from your account when you hold trades past the daily close.
Suppose you make $500 profit on a EUR/USD trade. After accounting for costs:
- Spread reduces the profit by $20.
- The commission reduces the profit by $7.
- Swap reduces the profit by $15.
So, the final net profit equals:
$500 – $20 – $7 – $15 = $458
According to FIBO Group’s swap archives and Windsor Brokers’ fee structure, traders who ignore cost calculation risk overtrading and depleting their accounts over time.
So, every smart trader plans for these costs before opening any position. Success depends on knowing exactly how much each trade will cost—not after the fact, but in advance.
How to Track Day P/L vs Overall P/L?
Professional traders separate day P/L from overall P/L to control both short-term and long-term performance. Because each one serves a different purpose. Day P/L shows how you performed today. Overall P/L tracks your full trading record.
Here’s how to track both properly:
- Start your trading day by recording the account balance at 5 PM EST or your broker’s daily rollover time.
- Track every trade’s result throughout the day by noting the realized profit or loss after closing each position.
- Add up all closed trades for the day to calculate day P/L.
- Include swap, spread, and commission when adding day P/L to get the true daily figure.
- Log the day P/L separately from the main account history to review daily consistency.
- Track overall P/L by summing up all past trading days, including profits, losses, and costs.
- Compare day P/L to overall P/L weekly to assess whether daily performance aligns with long-term goals.
- Use both numbers to decide when to scale positions, pause trading, or adjust strategies.
How Do You Use P/L Ratios to Manage Risk?
Let’s say you decide to trade EUR/USD. Before entering, you set a clear plan because risk control starts before execution—not after the trade closes. You choose a stop-loss of 50 pips and a take-profit of 100 pips. That creates a 2:1 profit-to-loss ratio.
So, for every trade, you risk 50 pips to make 100 pips. This structure protects your account because it lets you stay profitable even if you lose more trades than you win.
Suppose you take 10 trades using this ratio:
- You win 4 trades × 100 pips = 400 pips profit
- You lose 6 trades × 50 pips = 300 pips loss
The final result is:
400 pips profit – 300 pips loss = 100 pips net gain
So, your account grows even with only 40% accuracy. That’s the power of setting a positive P/L ratio. You avoid depending on constant wins because the math works in your favor.
Now consider the opposite case. Let’s say you risk 100 pips to make 50 pips. That’s a 0.5:1 ratio. Even with a high win rate, you could still end up losing over time because your losses are too large compared to your gains.
According to Investopedia’s trading risk guide, professional traders survive in the long term because they control risk through strict P/L ratios as part of overall Forex risk control.
So, every decision starts with the same question: How much do you risk compared to what you expect to gain? Your career in trading depends on that answer.
What Is APPT and Why Should You Track It Alongside P/L?
It’s possible that you win trade after trade, but your account balance still shrinks. That happens when you ignore the true profitability of your strategy. Focusing only on profit and loss hides the deeper math behind your results. Professional traders solve this by tracking APPT, or Average Profitability Per Trade, alongside regular P/L.
APPT tells you how much you expect to make or lose per trade over the long term. The calculation combines win rate, average win size, loss rate, and average loss size. So, you get a clearer picture of your trading edge—not just how much you won or lost today.
The formula looks like this:
APPT = (Win Rate × Average Win) – (Loss Rate × Average Loss)
Let’s work through an example.
Suppose you take 10 trades:
- You win 4 trades. Each win gives you $200.
- You lose 6 trades. Each loss costs you $100.
Now apply the formula:
APPT = (0.4 × $200) – (0.6 × $100) = $80 – $60 = $20
That result means you expect to make $20 per trade. So, your long-term system is profitable even with more losing trades than winners.
Now look at another case. It’s possible that you win 7 out of 10 trades, but your wins are too small. Each win gives $50, and each loss costs $150.
The APPT becomes:
APPT = (0.7 × $50) – (0.3 × $150) = $35 – $45 = -$10
So, even with a 70% win rate, you expect to lose $10 per trade. That’s why the win rate alone is not enough.
Turn Knowledge into Profit
You've done the reading, now it's time to act. The best way to learn is by doing. Open a free, no-risk demo account and practice your strategy with virtual funds today.
Open a Free Demo AccountFinal Words
Now it must be clear that trading success depends on controlling P/L, risk ratios, and APPT. Every trader needs this structure to protect the account and avoid emotional decisions. Without it, profits disappear quickly, no matter how skilled you feel.
So, what should you do next?
- Start a trading journal to log P/L, lot size, trade reason, and APPT after each session.
- Define risk and reward levels before opening any trade.
- Review your weekly results to catch mistakes early.
- Track daily P/L separately from overall P/L to measure short-term and long-term performance accurately.
Remember that consistent trading comes from disciplined tracking. Each trade you place must follow the numbers clearly. That’s how professional traders build lasting success—and how you take control of your own forex journey.