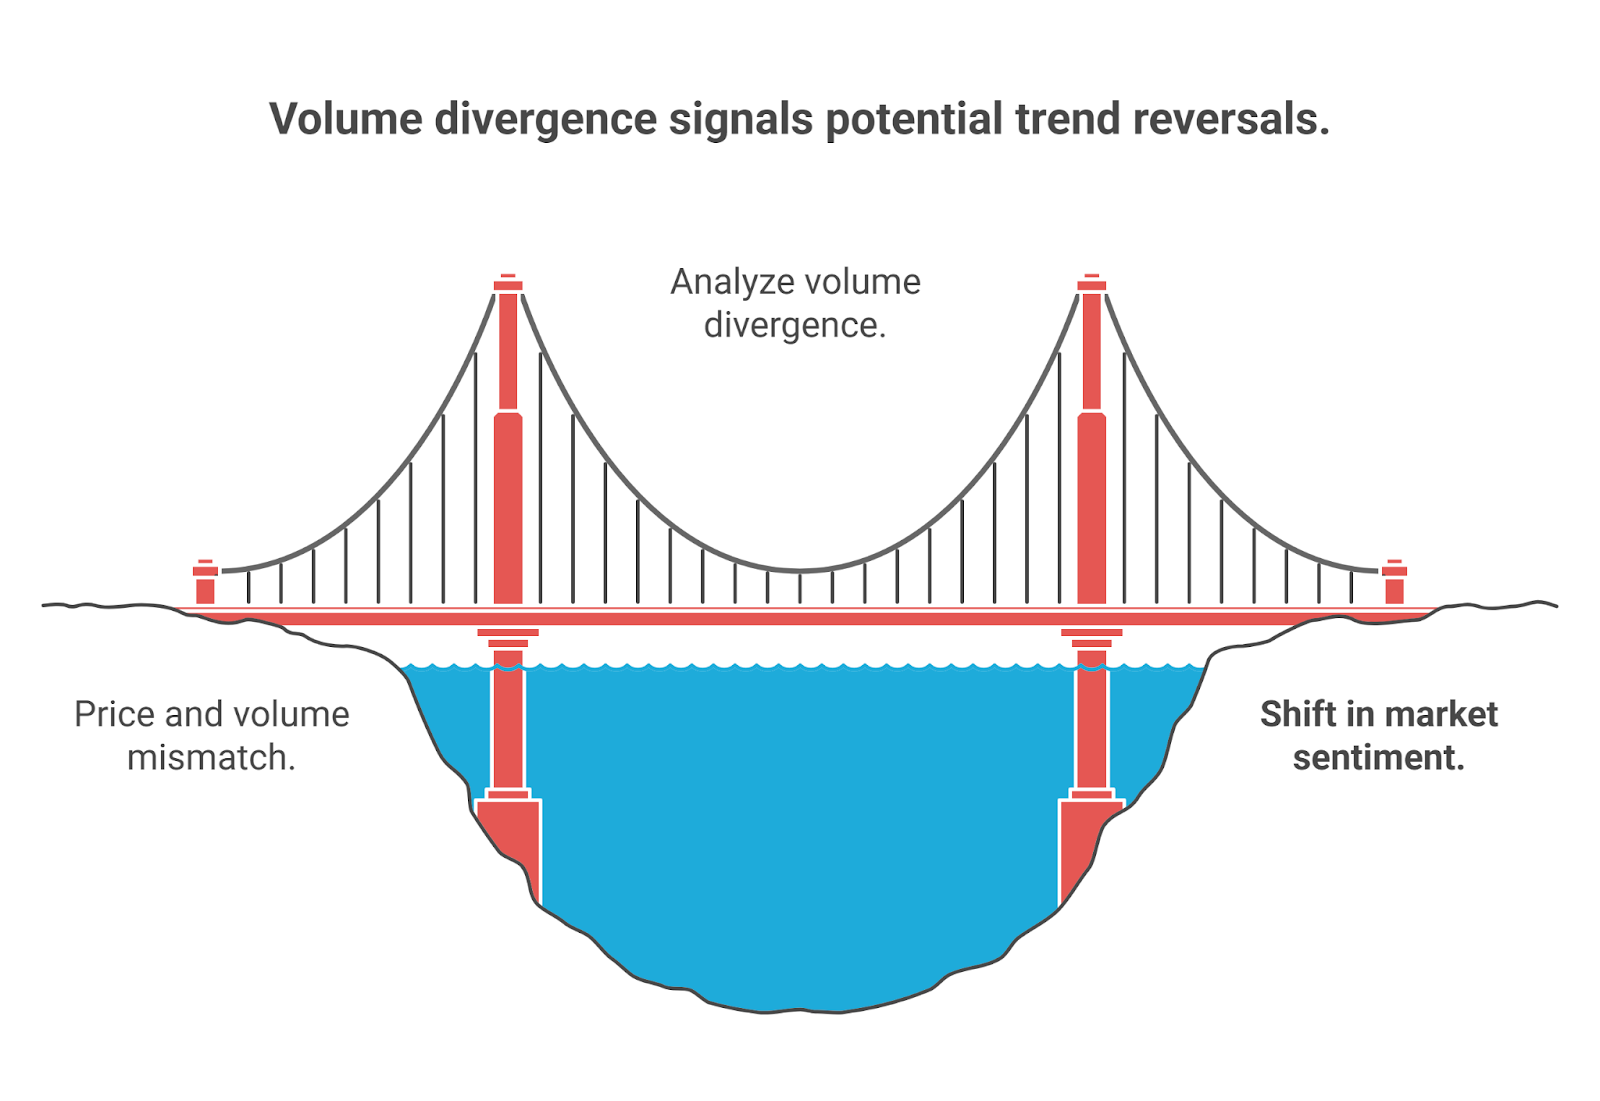
Volume divergence highlights a mismatch between price movement and trading volume, often signaling a shift in market momentum. It can indicate potential trend reversals or continuations before they become obvious on the chart.
This article explains what volume divergence is, how to identify it, and how to use it effectively within a broader trading strategy.
While understanding Volume Divergence is important, applying that knowledge is where the real growth happens. Create Your Free Forex Trading Account to practice with a free demo account and put your strategy to the test.
Key Takeaways
- Volume divergence signals a disconnect between price movement and trading volume.
- Regular divergence indicates potential trend reversals.
- Hidden divergence suggests trend continuation.
- Divergence is stronger when confirmed by OBV, RSI, or MACD.
- Use multi-timeframe analysis to validate divergence signals.
- Always apply risk management—stop-losses and position sizing are essential.
What is Divergence?
Divergence occurs when price movement disagrees with a technical indicator, such as RSI or MACD. Normally, rising prices align with rising momentum, and falling prices with declining momentum. When this alignment breaks, it may signal a weakening trend or upcoming reversal.
What is Volume?
Volume is the number of units traded during a specific period. It reflects market interest and the strength behind buying or selling pressure. High volume during price increases suggests strong buying; during declines, it signals strong selling.
The core principle is “volume precedes price,” meaning changes in volume often occur before price moves. Price moves backed by high volume are typically more reliable than those on low volume.
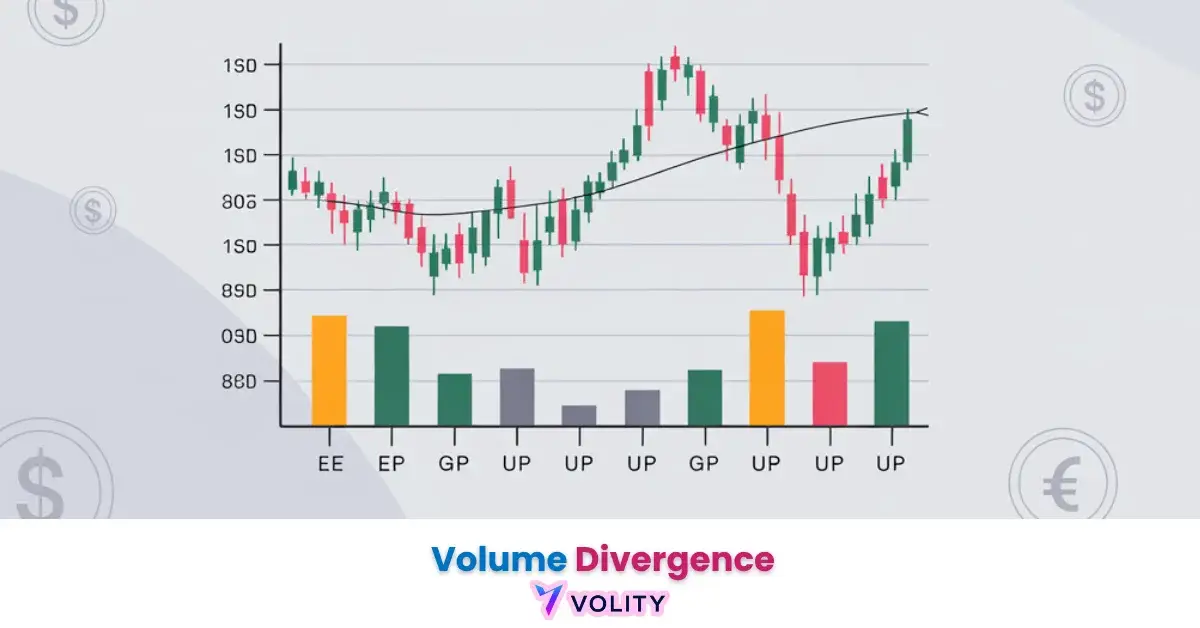
What is Volume Divergence?
Volume divergence occurs when price and volume move in opposite directions. This mismatch often signals a shift in market sentiment and can act as an early warning for trend changes. For example, if price reaches higher highs while volume declines, it indicates weakening momentum and reduced buyer conviction. On the other hand, if price is falling but volume rises, it may suggest that selling pressure is fading and a bullish reversal could follow.
Volume divergence reflects how traders respond to price levels. When fewer participants are willing to support rising prices with volume, it often implies that institutional traders might be offloading positions while retail traders keep buying—making the trend vulnerable to reversal.
When price makes higher highs but volume declines, it signals weakening momentum and reduced buying conviction. This often means smart money may be exiting positions while others continue buying, creating a fragile trend prone to reversal. Watching for this kind of volume-price mismatch can give you an early edge in spotting turning points before they become obvious on the chart.
What are the Types of Volume Divergence?
Divergence patterns fall into two main categories: Regular (or Classic) Divergence, which signals potential trend reversals, and Hidden Divergence, which indicates trend continuation. Both can be bullish or bearish.
Regular Divergence (Reversal Signals)
Regular divergence is a strong signal of a weakening trend and diminishing market momentum, often foreshadowing a market reversal.
- Regular Bullish Volume Divergence: This occurs when the price forms lower lows, but the corresponding volume indicator (like On-Balance Volume, OBV) forms higher lows.Despite the price decline, selling pressure is waning, and buying pressure is subtly increasing, suggesting bears are losing strength and bulls are gaining control. It often marks the exhaustion of a downtrend and signals a potential reversal to the upside.
- Regular Bearish Volume Divergence: This pattern is observed when the price forms higher highs, but the associated volume indicator forms lower highs.It indicates that despite rising prices, buying interest is waning, and selling pressure is increasing.This suggests bulls are losing their grip, and the upward movement may be driven by inertia, foreshadowing a potential price decline.
Ready to Elevate Your Trading?
You have the information. Now, get the platform. Join thousands of successful traders who use Volity for its powerful tools, fast execution, and dedicated support.
Create Your Account in Under 3 MinutesHidden Divergence (Continuation Signals)
Hidden divergence is equally important but signals a continuation of the prevailing trend rather than a reversal. It reveals subtle shifts that reinforce the existing trend’s direction.
- Hidden Bullish Volume Divergence: This occurs within an existing uptrend when the price forms a higher low, but the associated volume indicator forms a lower low. This indicates that despite a temporary pullback, underlying bullish momentum is strengthening or being absorbed by strong demand. Buyers are still in control, and the uptrend is likely to resume.
- Hidden Bearish Volume Divergence: This pattern is observed within an existing downtrend when the price forms a lower high, but the associated volume indicator forms a higher high. This indicates that despite a temporary rally, the underlying bearish momentum remains strong, and the downtrend is likely to continue.
| Divergence Type | Price Action | Volume Indicator Action | Signal Purpose | Context |
| Regular Bullish | Lower Lows | Higher Lows | Trend Reversal | Downtrend |
| Regular Bearish | Higher Highs | Lower Highs | Trend Reversal | Uptrend |
| Hidden Bullish | Higher Lows | Lower Lows | Trend Continuation | Uptrend |
| Hidden Bearish | Lower Highs | Higher Highs | Trend Continuation | Downtrend |
How to Spot Volume Divergence on Charts?
Identifying volume divergence requires careful visual analysis of price action and trading volume.
- Visual Analysis: Connecting Peaks and Troughs: Draw trendlines connecting successive major highs or lows on the price chart and compare their slope to the corresponding highs or lows on your chosen volume indicator. Focus on significant swing highs and lows, ignoring minor fluctuations. The points on the indicator must align vertically with the price highs or lows. Divergence is confirmed if the slope of the indicator’s line differs from the price’s line.
- Key Volume and Momentum Indicators: While many indicators can show divergence, some are particularly effective:
- On-Balance Volume (OBV): This cumulative indicator tracks buying and selling pressure.
- Bullish OBV Divergence: OBV moves higher or forms a higher low while price moves lower or forms a lower low, indicating increasing buying pressure.
- Bearish OBV Divergence: OBV moves lower or forms a lower low while price moves higher or forms a higher high, suggesting increasing selling pressure.
- Relative Strength Index (RSI): A momentum oscillator (0-100) that measures the speed and change of price movements. RSI divergence (e.g., price new highs, RSI lower highs) is frequently used to confirm volume divergence.
- Moving Average Convergence Divergence (MACD): A trend-following momentum indicator. MACD divergence (e.g., price higher high, MACD histogram lower high) can effectively confirm volume divergence.
- Other Relevant Oscillators: Money Flow Index (MFI) , Stochastic Oscillator , and Commodity Channel Index (CCI) can also be used.
- On-Balance Volume (OBV): This cumulative indicator tracks buying and selling pressure.
How to Apply Volume Divergence Strategically?
When properly identified and confirmed, volume divergence can significantly enhance your trading strategy.
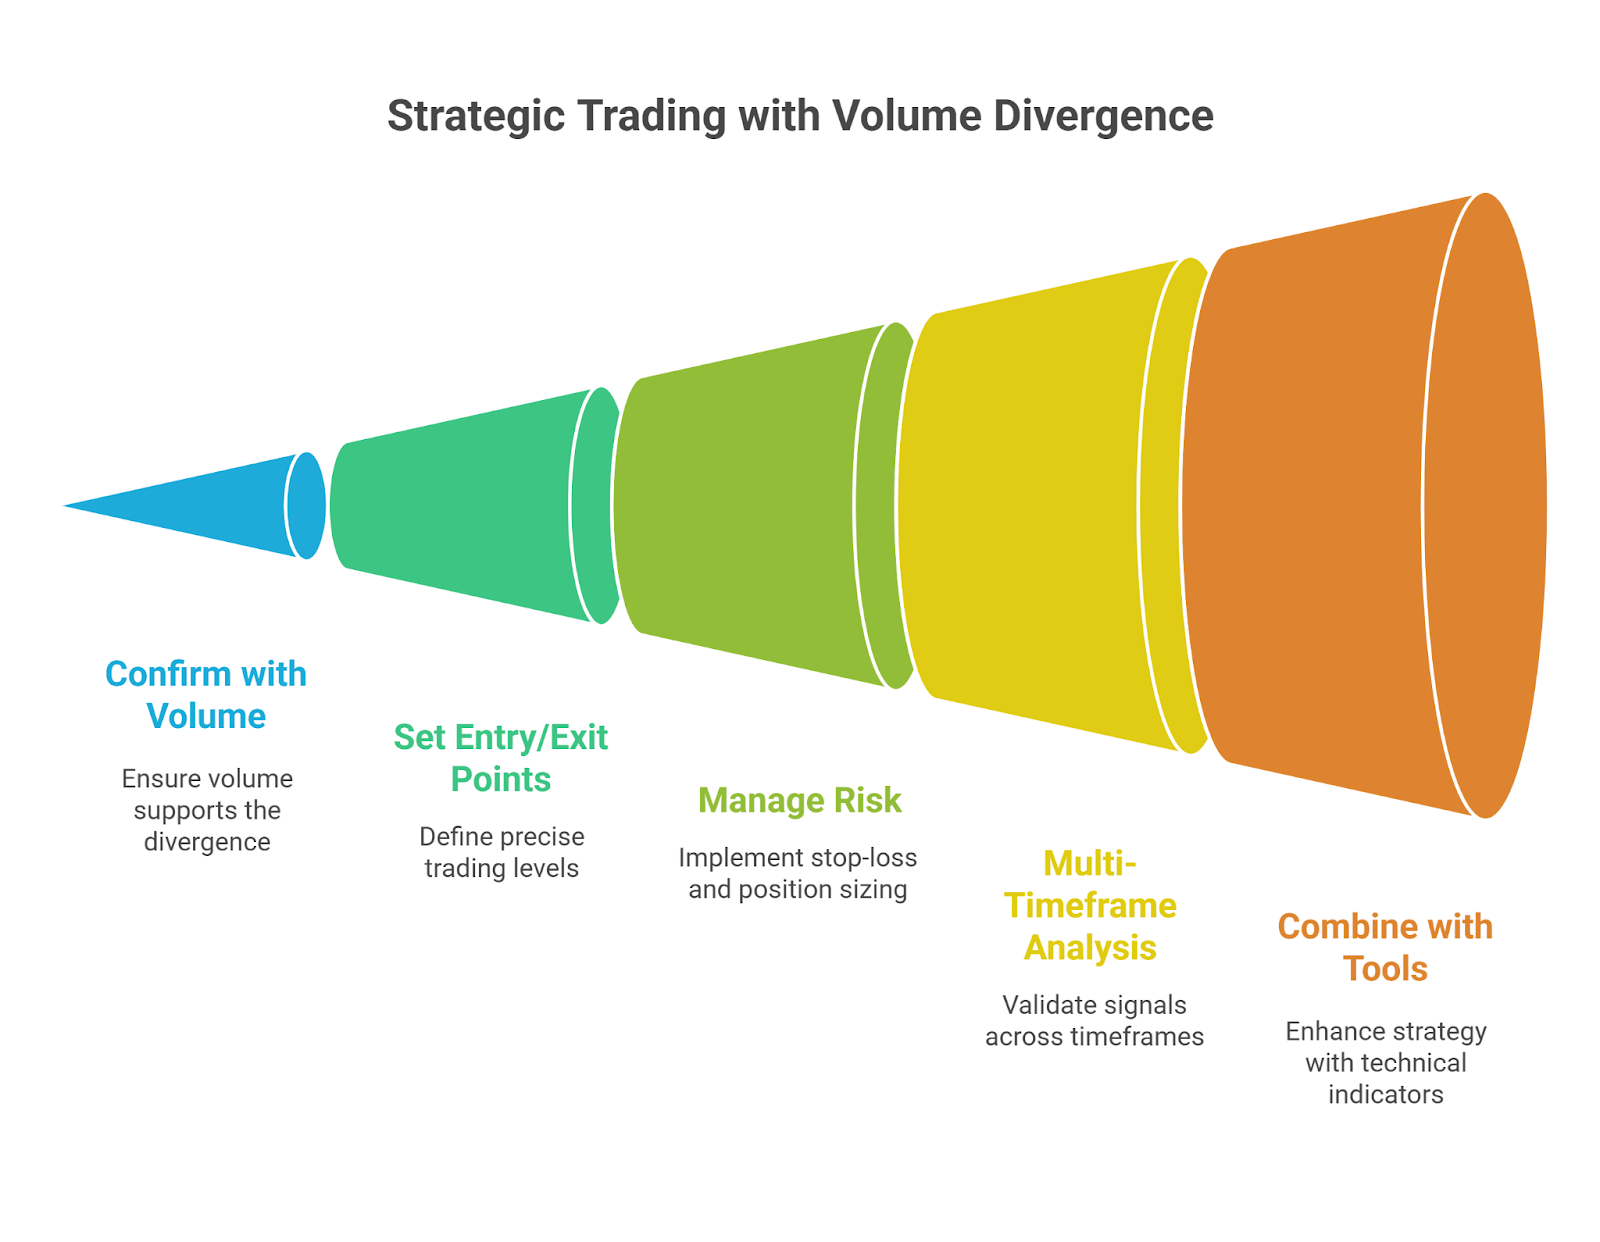
- Entry and Exit Strategies:
- Entry: For a bullish divergence, wait for the price to break above a downtrend line, ideally with a surge in volume. For a bearish divergence, consider entry upon a break below an uptrend line with increased volume.
- Exit: Consider taking initial profits at key Fibonacci retracement levels (e.g., 61.8% of the previous downtrend). Continuously monitoring for new volume-price disconnects can also serve as an exit signal.
- Risk Management and Position Sizing:
- Stop-Loss Orders: Implement strict risk control with stop-loss orders. For example, place stops at 2x the Average True Range (ATR) below your entry point to account for market volatility.
- Position Sizing: Risk only 1-2% of your trading capital per trade.
- Trailing Stops: In trending markets, the 21-period Exponential Moving Average (EMA) can be a reliable reference for trailing stops. In volatile conditions, set trailing stops at 3x the ATR below rolling price highs.
- Multi-Timeframe Analysis for Confirmation:
Divergence signals are generally more accurate on higher timeframes (e.g., 1-hour, 4-hour, daily, or weekly charts).- Identify the overall trend and primary divergence patterns on higher timeframes.
- Then, descend to the middle (e.g., 4-hour or 1-hour) or lower timeframes (e.g., 15-minute or 5-minute) to confirm signals and pinpoint precise entry/exit points. A 4-6x ratio between timeframes is a good rule of thumb.
- Combining Volume Divergence with Other Technical Tools:
Divergence is rarely a standalone indicator; its effectiveness is significantly amplified when combined with other tools.- Candlestick Patterns: Bearish candlestick formations (doji, shooting stars) at price highs with declining volume strengthen a bearish divergence. Bullish patterns (outside bar, reversal bar) can confirm hidden bullish divergence.
- Support and Resistance Levels: Divergences near major support or resistance levels are often more powerful and reliable. High volume accompanying breakthroughs or breakdowns confirms conviction.
- Trendlines and Moving Averages: A price breaking a trendline with high volume after a divergence provides strong confirmation. Moving averages can help identify reversals when volume behaves divergently as price approaches them.
- Volatility Filters: Tools like ATR and Bollinger Bands can enhance trading by focusing on significant price movements and ensuring volume surges.
- Order Block Analysis and Smart Money Concepts: Analyzing volumetric data to identify institutional activity zones can provide deeper insights into where major players are active, aligning with the “volume precedes price” premise.
What are the Limitations of Volume Divergence?
While a powerful tool, volume divergence has inherent limitations that traders must understand.
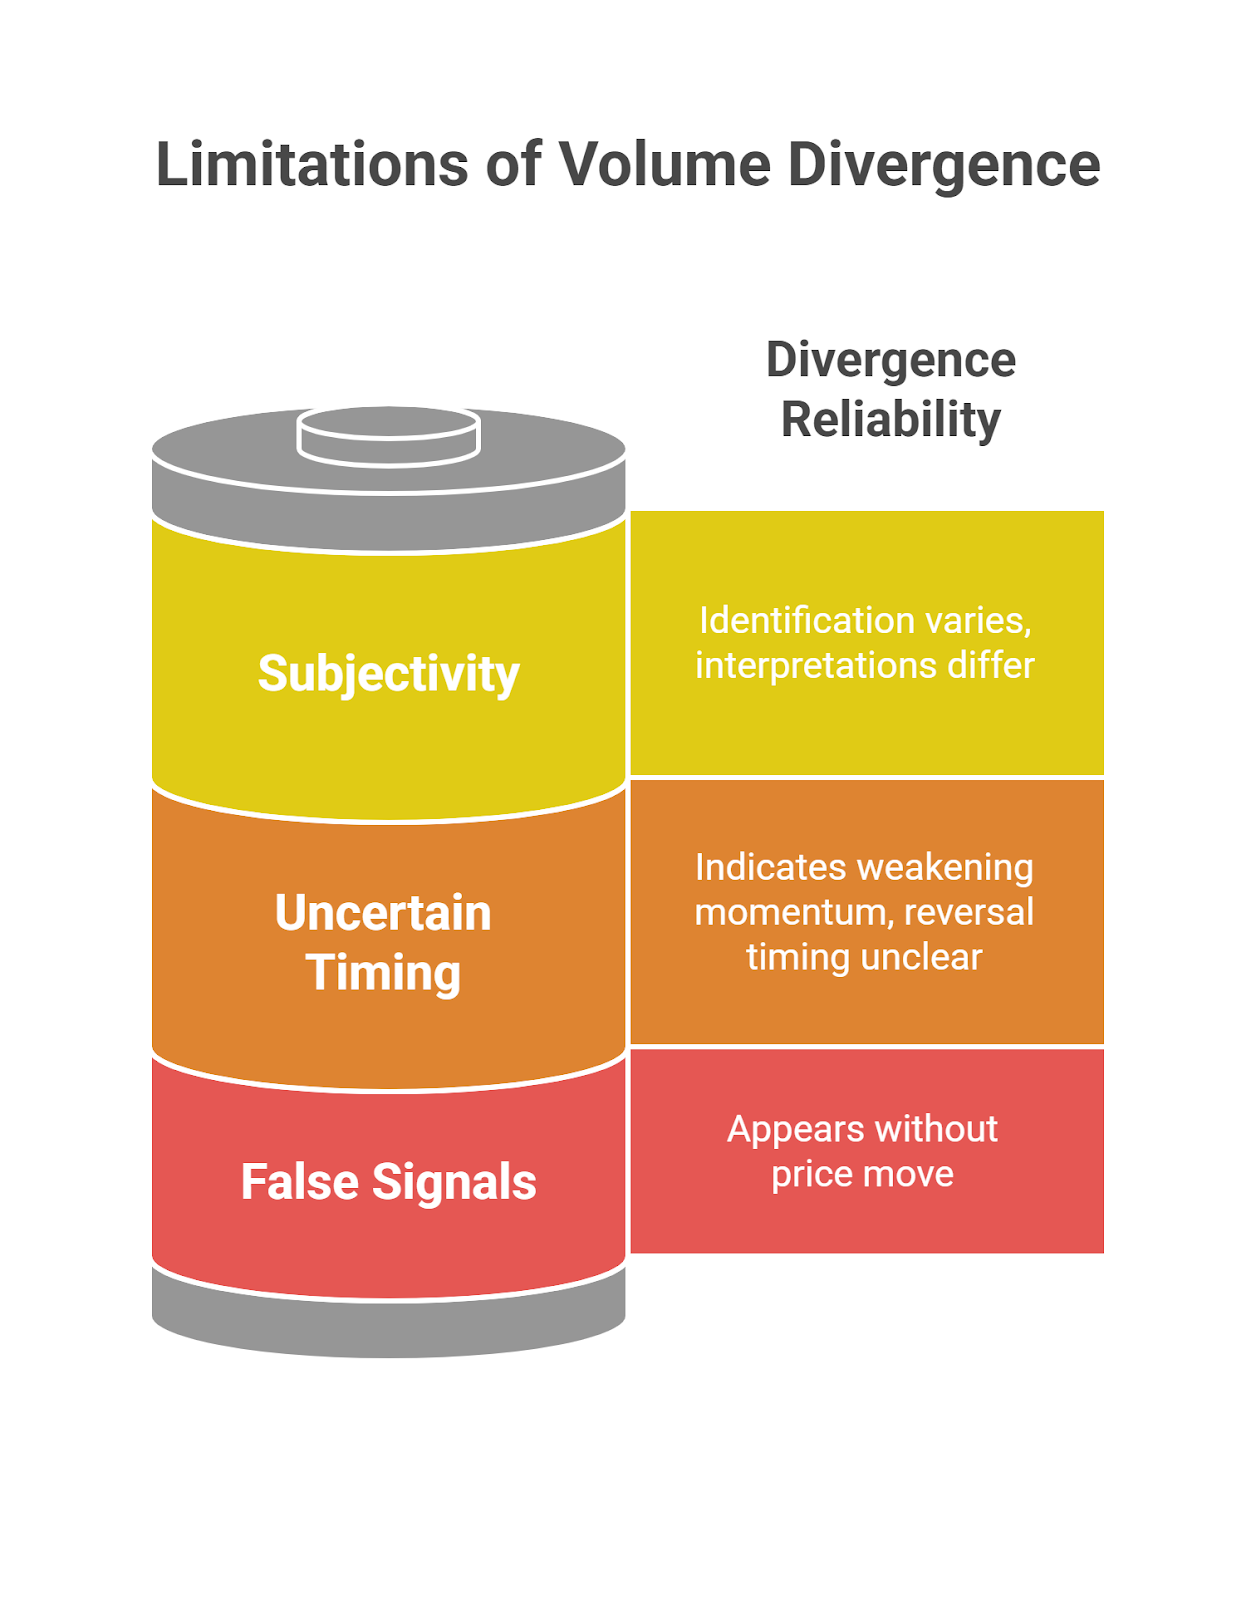
- False Signals: Not every divergence leads to a trend change. In choppy markets or during strong trends, divergences can appear without a significant price move or persist for extended periods.
- Uncertain Timing: Divergence indicates weakening momentum but doesn’t pinpoint when a reversal will occur. Acting too early can lead to drawdowns.
- Subjectivity in Identification: Identifying significant highs or lows on an indicator can be subjective, leading to varying interpretations.
- Indicator Lag: Momentum indicators are derived from price, so they inherently lag. Divergence often becomes apparent only after several periods, potentially leading to late signals.
Best Practices for Effective Application of Volume Divergence
Here are some of the best practices for actual application of Volume divergence in trading:
- Confirmation is Key: Never rely solely on volume divergence. Always seek confirmation from other technical indicators, price action patterns, or structural breaks.
- Multi-Timeframe Analysis: Crucial for filtering noise and improving signal reliability.
- Robust Risk Management: Implement strict risk control, including consistent stop-loss orders and proper position sizing (1-2% of capital per trade).
- Trade Filtering: Avoid trading during major news releases or in low-liquidity environments. Stick to divergence setups observed on charts of 1-hour duration or longer to minimize noise.
- Continuous Learning and Adaptation: Financial markets are dynamic. Continuous learning, backtesting strategies, and adapting to evolving market conditions are essential for long-term success.
Turn Knowledge into Profit
You've done the reading, now it's time to act. The best way to learn is by doing. Open a free, no-risk demo account and practice your strategy with virtual funds today.
Open a Free Demo AccountConclusion
Volume divergence is a leading technical signal that reveals imbalances between price and volume, helping traders anticipate trend reversals or continuations. It works on the principle that volume changes often precede price moves, offering insight into market sentiment. When used with tools like OBV, RSI, MACD, chart patterns, and multi-timeframe analysis, its reliability improves. Still, traders must be cautious of false signals and timing uncertainty. Strong risk management—through stop-loss orders and proper position sizing—is essential. When used correctly, volume divergence is a valuable tool for identifying market shifts and improving trade decisions.