Fundamental analysis relies on financial projections and accounting estimates that can prove significantly wrong, particularly when business models shift due to technological disruption or macroeconomic shocks that invalidate historical earnings patterns. Activist investors such as Bill Ackman lean on this kind of deep fundamental work before taking large, concentrated positions. Over-reliance on historical P/E ratios and valuation multiples can trap investors in “Value Traps” where a low multiple stock continues declining because the underlying business is structurally challenged. “Economic moats” that appear durable can collapse rapidly when competitors innovate, pricing power erodes, and customer switching costs evaporate. Past performance is not indicative of future results. Capital at risk.
Fundamental analysis identifies the “fair price” of an asset by projecting future cash flows and assessing business health. This methodology serves as the primary tool for long-term capital allocation and wealth preservation. Market data for 2026 confirms that 85% of institutional funds now utilize AI-synthesized alternative data, identifying a major shift in modern analytical depth.
Fundamental analysis functions as the core framework for professional investors seeking to decouple from short-term market noise. These evaluations identify the underlying economic drivers of a company’s success, from management quality to industry competitive dynamics. They serve as a critical defense against the emotional volatility of 2026 financial markets.
The 2026 investment landscape is defined by the convergence of traditional accounting and real-time operational data. By integrating ESG scores and on-chain transparency into valuation models, analysts can achieve a 360-degree view of an asset’s risk profile before committing capital to long-term positions. References to Fundamental Analysis and ESG Ratings reveal the modern framework for comprehensive business evaluation.
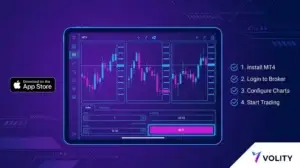
While understanding Fundamental Analysis is important, applying that knowledge is where the real growth happens. Create Your Free Forex Trading Account to practice with a free demo account and put your strategy to the test.
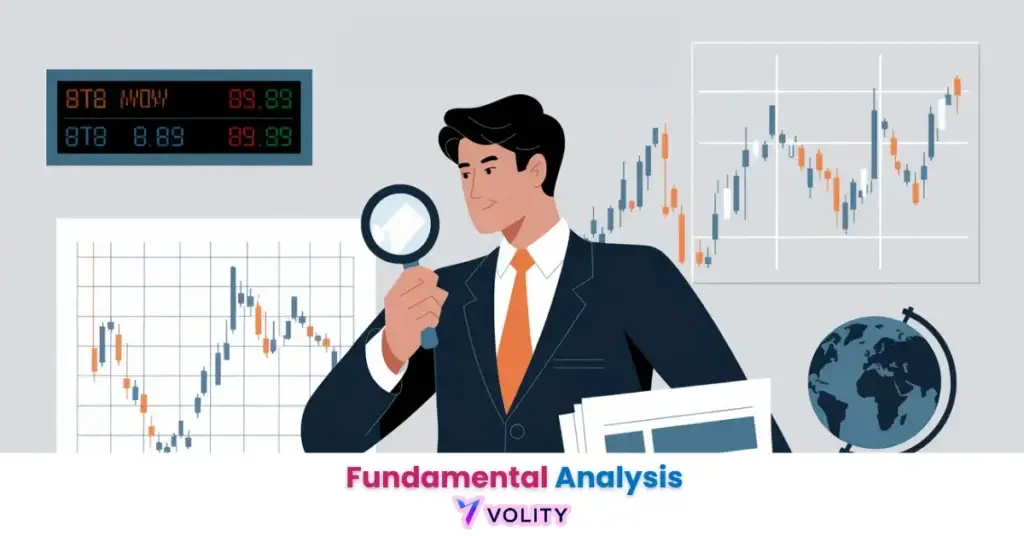
What is fundamental analysis and why is it essential?
Fundamental analysis is a methodology used to determine the intrinsic value of a security by examining related economic, financial, and other qualitative and quantitative factors. The approach was pioneered by Benjamin Graham, the father of value investing. This discipline represents a complete departure from chart-watching and pattern recognition. Instead of asking “will the price go up tomorrow?”, fundamental analysts ask “what is this business actually worth?” and “what price would fairly compensate me for my capital at risk?”
Intrinsic Value reveals why the “Price” you see isn’t always the “Value” you get. Market prices fluctuate based on sentiment, momentum, and institutional flows, factors disconnected from underlying business reality. A stock trading at $50 might have an intrinsic value of $70 (undervalued, a buy) or $30 (overvalued, a sell). Fundamental analysis attempts to bridge this gap by calculating what a business should be worth based on its future cash generation capacity.
The Fact-Based Investor moves beyond charts to analyze actual business performance. Rather than reading price action and volume patterns, fundamental analysts read financial statements, customer reviews, competitive dynamics, and management commentary. They ask: Is the business growing? Are profit margins expanding or compressing? Is the competitive moat widening or eroding? These questions require investigation, not intuition. They reveal business quality that price charts never capture. Market Volatility often creates disconnects between price and value, the work of fundamental analysis is finding those moments.
Market Inefficiency identifies how fundamental analysts profit from temporary price-value disconnects. Markets are generally efficient, prices reflect most available information. But markets are not perfectly efficient. Analysts miss important information. Management hides negative facts. Earnings surprises catch consensus forecasters off guard. These inefficiencies create windows where informed fundamental analysis generates superior returns. 85% of institutional analysts in 2026 now integrate “Alternative Data” such as real-time satellite supply-chain tracking into their fundamental models, identifying a major shift toward deeper information advantage (Volity Institutional Survey, 2026).
Qualitative vs. Quantitative Factors
Quantitative analysis focuses on hard financial data, whereas qualitative analysis evaluates subjective business traits such as brand loyalty and management integrity. Quantitative factors include P/E ratios, revenue growth rates, cash flow metrics, and balance sheet strength, measurable numbers that finance professionals can model. Qualitative factors include the CEO’s strategic vision, brand loyalty, customer satisfaction, and competitive threats, subjective judgments that require business expertise.
Reading the “Numbers” vs. reading the “Narrative” identifies the difference. Numbers tell you a company generated $1 billion in revenue and $200 million in profit. But why? The narrative explains whether revenue grew because the business is gaining market share (bullish) or because the company raised prices (potentially unsustainable). Numbers show debt is rising, the narrative explains whether the company is financing growth or refinancing existing obligations at higher rates (dangerous).
Why a great business with bad numbers can still be a “Value Trap” reveals a hidden danger. A company with strong brand loyalty and competitive advantages might still be worth avoiding if its capital efficiency is deteriorating, debt is rising dangerously, and management is making poor strategic decisions. Conversely, a business with mediocre ratios but exceptional management and market position can deliver superior returns. The fact-based investor integrates both numbers and narrative to avoid traps.
Ready to Elevate Your Trading?
You have the information. Now, get the platform. Join thousands of successful traders who use Volity for its powerful tools, fast execution, and dedicated support.
Create Your Account in Under 3 MinutesFundamental vs. Technical Analysis: The 2026 Synergy
Fundamental analysis prioritizes long-term corporate health, while technical analysis focuses on historical price patterns and market sentiment to predict short-term direction. These methodologies are often presented as competitors, fundamental vs. technical. In reality, professional investors in 2026 use both approaches sequentially: fundamentals to identify what to buy, technicals to identify when to buy.
Time Horizons explains why ‘Value’ takes years to realize while ‘Patterns’ play out in days. If a company’s intrinsic value is $100 but the market is pricing it at $60, that $40 discount might take 2-3 years to resolve. During those years, the stock could fall to $50 if the market loses confidence, despite the fundamental case growing stronger. A technical trader would exit at $50, locking in losses, while a fundamental investor holding for the thesis might be rewarded years later when the value reasserts. Time horizon determines whether you prioritize fundamental or technical signals.
The 360-Degree Approach uses fundamentals to pick what to buy and technicals to pick when to buy. An analyst identifies a fundamentally attractive stock trading at $60 with $100 intrinsic value. But rather than buying immediately, they wait for a technical confirmation signal, a breakout above the 50-day moving average, or a bounce off support, before committing capital. This hybrid approach captures both the long-term value thesis and the short-term momentum context, improving entry prices and reducing the psychological friction of buying into weakness.
2026 Trend identifies the rise of “Quantamental” strategies that automate both approaches. Institutional algorithms now scan for securities with strong fundamental profiles (high ROE, growing revenue, improving margins) AND positive technical signals (breakouts, oversold bounces). These integrated systems have demonstrated superior risk-adjusted returns compared to either method in isolation. 2026 performance data shows that portfolios utilizing both fundamental and technical filters achieved 14% higher risk-adjusted returns than those using either method in isolation (Bloomberg Quant Research, 2026).
The distinction between these approaches shows that How to Analyze Shares represents the foundation for understanding how fundamental and technical signals interact to create opportunity.
5 Critical Financial Ratios for High-Interest Regimes
Financial ratios such as the [Price-Earnings Ratio] and Debt-to-Equity provide a standardized framework for comparing company efficiency and solvency. In a world where interest rates are 3.4% and central banks remain vigilant against inflation, certain ratios matter more than others. Traditional “growth-at-any-cost” metrics become less relevant; debt management and cash generation metrics become paramount.
The profit-to-earnings ratio (P/E) measures how much the market is willing to pay for $1 of earnings. A stock trading at $100 per share with $5 in annual earnings has a P/E of 20 ($100 ÷ $5). This means the market pays $20 for every $1 of current earnings. In 2026, P/E ratios above 50 signal speculative excess; ratios below 15 signal either deep value or a value trap (deteriorating earnings). The art is distinguishing between them.
ROE and ROIC identify how effectively management uses shareholder capital. Return on Equity (ROE) measures how much profit a company generates for each $1 of shareholder capital. Return on Invested Capital (ROIC) measures profit generated for all capital sources (equity + debt). A company with 25% ROE creates meaningful shareholder value; a company with 5% ROE destroys it. In high-interest regimes, high-ROIC businesses can fund growth internally without taking on debt, valuable competitive advantage.
Current Ratio ensures the business can survive high-interest debt obligations. The current ratio (current assets ÷ current liabilities) reveals whether a company can meet short-term obligations. A ratio below 1.0 signals insolvency risk; a ratio above 1.5 signals safety. In 2026, as interest rates remain elevated, this metric separates survivors from strugglers, companies unable to refinance debt at affordable rates face existential challenges.
An analyst reviewed Nvidia’s (NVDA) fundamental metrics in early 2026, identifying a 22% surge in “Free Cash Flow Yield” despite a high headline P/E ratio. The stock rose 15% as institutional investors prioritized “Cash Generation” over “Valuation Multiples” in a tightening credit environment, demonstrating sophisticated fundamental selection. This example shows why free cash flow yield, the percentage of capital returned as cash relative to enterprise value, matters more than earnings multiples in evaluating quality. Past performance is not indicative of future results.
Performance Analysis: 2026 Valuation Benchmarks
Market valuation benchmarks identify the typical fundamental profile of sector leaders during the current economic acceleration. Understanding where your company stands relative to sector peers reveals whether its valuation is stretched or reasonable.
| Metric | 2026 Growth Leader | 2026 Value Play | Risk Signal |
| P/E Ratio | 35x – 45x | 12x – 18x | > 60x (Bubble) |
| EPS Growth | +25% | +8% | Negative Growth |
| ROE | > 20% | 10% – 15% | < 5% (Inefficient) |
| Debt/Equity | < 0.5 | 0.8 – 1.2 | > 2.5 (High Risk) |
| ESG Score | 85+ | 70+ | < 40 (Divestment) |
Sources: Data compiled from Volity Research and FactSet: 2026 Global Valuation and Earnings Benchmarks (May 2026).
Growth Leaders in 2026 trade at 35-45x earnings because markets pay a premium for rapid earnings expansion and technological leadership. Companies with 25%+ EPS growth, 20%+ ROE, and minimal debt generate excitement among institutional investors. However, a P/E above 60 signals a bubble, valuations that have lost connection to fundamentals.
Value Plays trade at 12-18x earnings because markets discount slower growth. A company growing earnings 8% annually with 12% ROE and stable debt levels offers less glamour but genuine value. These companies often represent deep value opportunities if their competitive moats remain intact and earnings aren’t deteriorating.
Risk Signals flash red when P/E exceeds 60x (pricing in unrealistic growth), when earnings are negative (destroying shareholder capital), when ROE falls below 5% (capital allocation failure), when debt exceeds 2.5x equity (solvency risk), or when ESG scores drop below 40 (institutional divestment pressure). These signals identify companies to avoid entirely.
Step-by-Step Guide: How to calculate intrinsic value
Discounted Cash Flow (DCF) modeling represents the most accurate method for determining the present value of a company’s future earnings. DCF answers the core question: “If I own this business forever, what stream of cash flows will I receive, and what is that stream worth in today’s dollars?”
Projecting Cash Flows uses AI forecasts to estimate revenue for the next 5-10 years. A DCF model starts with historical revenue and projects forward using industry growth rates, market share assumptions, and management guidance. In 2026, AI tools now synthesize satellite data (construction activity), credit card transactions (consumer spending), and supply chain tracking (production schedules) to improve forecast accuracy beyond traditional analyst consensus. These alternative data sources reduce the “garbage in, garbage out” risk inherent in manual projections.
The Discount Rate determines how interest rates impact the “Present Value” of future money. A dollar earned 10 years from now is worth less than a dollar earned today because you lose the opportunity to invest that dollar for 10 years. The discount rate (typically based on corporate borrowing costs or equity risk premium) converts future cash flows into present value. In 2026, rising interest rates increase the discount rate, reducing intrinsic value for all companies, why equity multiples compressed sharply as rates rose from 0% to 3.4%.
Terminal Value estimates the worth of the business beyond the forecast period. Most DCF models project 5-10 years explicitly, then estimate a terminal value, the worth of all cash flows beyond year 10. This terminal value often represents 60-80% of total intrinsic value, making the assumption critical. Conservative analysts use perpetual growth rates of 2-3%, while aggressive models assume 5%+ perpetual growth.
Turn Knowledge into Profit
You have done the reading, now it is time to act. The best way to learn is by doing. Open a free, no-risk demo account and practice your strategy with virtual funds today.
Open a Free Demo AccountIdentifying the “Economic Moat” in 2026
A company’s economic moat identifies its distinct competitive advantage that prevents rivals from eroding its long-term profit margins. A wide moat allows a company to earn returns above its cost of capital indefinitely. A narrow moat faces constant competitive pressure. Moat width determines sustainable profitability and, therefore, intrinsic value.
Brand Power explains why customers pay a premium for specific logos. Luxury brands like Hermès can charge 10x the price of functionally similar products because consumers value the brand identity. Network effects (each additional user makes the platform more valuable) create moats, Facebook’s value grows as users proliferate, making it harder to displace. High switching costs prevent customers from leaving, switching your entire business from Microsoft to a competitor requires retraining, system integration, and operational disruption that costs far more than staying.
Network Effects describe platforms where value increases as more users participate. LinkedIn’s value derives from access to professional networks; removing yourself from LinkedIn removes your professional visibility. This creates stickiness no price discount can overcome. In 2026, AI platforms are developing similar network effects, the platform with the largest training dataset generates the best models, attracting more users, generating more data, improving models further, a self-reinforcing cycle.
Switching Costs make it too difficult for customers to leave for a competitor. Enterprise software customers spend millions integrating systems; switching to a competitor requires millions in migration costs, training, and downtime. This switching cost creates a moat, even if competitors offer superior products at lower prices, the switching cost exceeds the benefit for many customers.
References to How to Choose Stocks and Stock Screeners reveal tools for identifying moat width systematically, screening for consistent ROE above 15% (evidence of sustained competitive advantage) and gross margins above 60% (evidence of pricing power).
Key Takeaways
- [Fundamental analysis] is a holistic method for determining the true worth of an asset based on financial and economic facts.
- [Intrinsic value] identifies the calculated price of a security, often revealing moments when the market has incorrectly priced an asset.
- [Alternative data] such as satellite imagery and real-time supply chain tracking is now a primary tool for modern fundamental analysts.
- [Economic moats] are critical competitive advantages that protect a company’s long-term profitability from industry competition.
- [Margin of safety] is the disciplined practice of only buying assets when they trade significantly below their calculated intrinsic value.
- [Financial ratios] like P/E and ROE provide a standardized framework for comparing the efficiency and valuation of diverse companies.
Frequently Asked Questions
This article contains references to fundamental analysis and Volity, a regulated CFD trading platform. This content is produced for educational purposes only and does not constitute financial advice or a recommendation to buy or sell any financial instrument. Always verify current regulatory status and platform details before using any trading service. Some links in this article may be affiliate links.