Investing in financial products involves risk. Losses may exceed the value of your original investment.
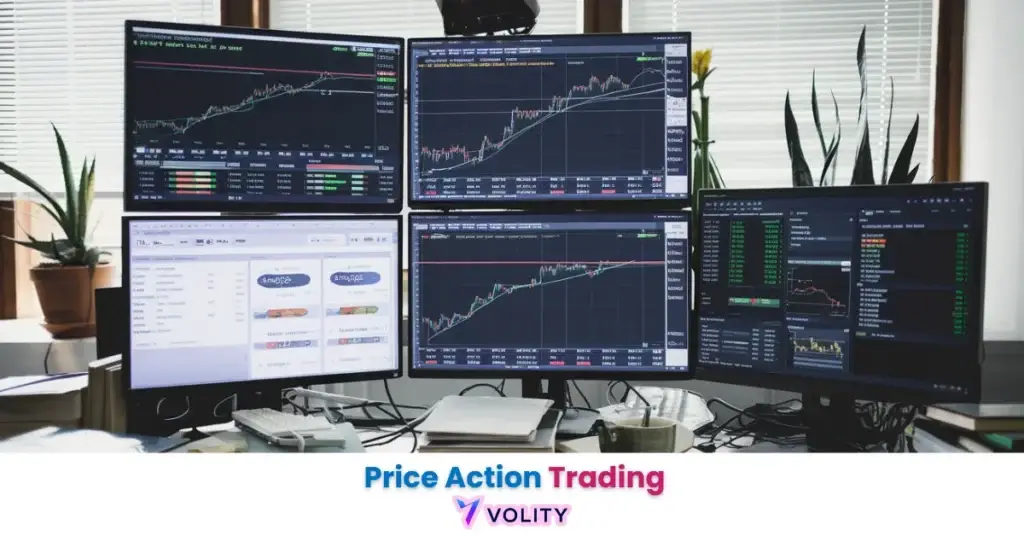
Price Action Trading is a trading strategy where traders solely analyze a financial asset’s price movements on a chart, without relying heavily on technical indicators, to identify potential entry and exit points, based on patterns formed by the price fluctuations and key levels of support and resistance, essentially reading the “language” of the market through price action alone. Moreover, price action trading is a strategy that helps to predict market movements by spotting patterns or ‘signals’ in the price movements of an underlying market. Learn about some different price action strategies here.
In fact, price action trading is a method that focuses solely on the movement of prices, without relying on indicators. This approach provides immediate data and clarity, which allows traders to stay attuned to what’s happening in the market at any given moment.
While understanding Price Action Trading is important, applying that knowledge is where the real growth happens. Create Your Free Forex Trading Account to practice with a free demo account and put your strategy to the test.
Price Action Trading
Price action trading focuses on price movement alone. Traders ignore technical indicators and base decisions on how price behaves over time.
The idea is simple. Price reflects all market information, including news, economic shifts, and investor sentiment.
Why do traders choose price action over other strategies? The answer is clarity.
Unlike fundamental analysis, which relies on external factors like earnings reports, price action uses historical price patterns to predict future moves. Traders study charts, spot trends, and identify key levels such as support and resistance.
Patterns repeat in financial markets. That’s why traders believe past price behavior offers clues about future direction. Instead of using indicators, they rely on candlestick formations, breakouts, and reversals. Some call it “naked trading” because it removes all unnecessary tools from the chart.
You must observe market behavior, recognize opportunities, and react quickly. A simple strategy doesn’t mean easy success. It requires patience, discipline, and a strong understanding of price movements. Are you ready to trade with a clean chart and trust the price alone?
How Price Action Trading Works?
Price action trading relies on historical price movements to make trading decisions. Traders analyze patterns like breakouts and consolidation to predict future price trends.
Investopedia states that traders focus on price charts without using indicators. A stock forming higher highs and higher lows often signals an uptrend.
Lower highs and lower lows indicate a downtrend. You can see, recognizing these patterns helps you identify potential entry and exit points.
Have you ever noticed how price patterns repeat over time? Many traders use this to their advantage.
Different traders can analyze the same chart and reach different conclusions. A study from Day Trade Review found that 97% of day traders lose money over time. Market conditions constantly change, which makes predictions challenging.
If you are applying price action strategies, it requires skill and experience. Success depends on reading price movements accurately and managing risks. Every trade involves uncertainty, but understanding price behavior improves decision-making. Developing a consistent trading edge helps discretionary traders refine their judgment and execute with confidence across volatile markets.
Key Price Action Trading Concepts
Price action trading is built on several key concepts. If you understand these concepts it is important to become a successful trader. Let’s dive into the basics.
Support and Resistance
Support and resistance levels are fundamental. Support is where price tends to stop falling.
Resistance is where price struggles to go higher. If price hits support, it may bounce back up.
If price hits resistance, it may reverse downward. Do you know how to identify these levels on your charts?
Traders use these areas to plan entries and exits. Sometimes, sharp rejections or consolidations around these zones are triggered by institutional block trades, which leave distinct volume footprints on the chart.
Trends
Markets move in trends. A trend shows the direction of price.
Trends can be upward, downward, or sideways. See, recognizing trends early helps you stay on the right side of the market.
For traders who prefer holding positions for weeks or months, positional trading applies these same trend-recognition principles on higher time frames.
Have you noticed how prices tend to follow a clear direction for a while? You should know if the trend is up or down is key to making profitable trades.
Breakouts and Fakeouts
A breakout happens when price moves past a support or resistance level. Traders see this as a sign of strong momentum.
However, sometimes the price quickly reverses after breaking a level. This is known as a fakeout.
According to a report from TradingView, about 30% of breakouts fail. Have you ever been caught in a fakeout?
Managing risk is crucial here. At times, sudden reversals emerge from a short squeeze setup, where trapped sellers fuel rapid upside moves visible through aggressive price action.
Candlestick Patterns
Candlestick patterns offer clues about price movements. Some patterns indicate a reversal, while others signal continuation.
Common patterns include Doji, Engulfing, and Pin Bars. Each one gives you insights into what might happen next.
Can you spot these patterns in your charts? Nobdoubt, learning to read candlesticks enhances your understanding of price action.
These concepts are the foundation of price action trading. If you want to know how to apply them, it makes a difference in your trading strategy. Would you like to dive deeper into any of these concepts?
Ready to Elevate Your Trading?
You have the information. Now, get the platform. Join thousands of successful traders who use Volity for its powerful tools, fast execution, and dedicated support.
Create Your Account in Under 3 MinutesCommon Price Action Trading Strategies
Price action trading involves several strategies. These strategies focus on chart patterns and price movements without relying on indicators. Let’s explore some common approaches.
Breakout Strategy
The breakout strategy involves entering a trade when price moves beyond a support or resistance level. Traders believe that once the price breaks through, it will continue in that direction. Do you watch for breakouts on your charts? This strategy works best when price shows strong momentum after breaking a key level.
Pullback Strategy
The pullback strategy takes advantage of temporary price retracements during a trend. If price moves in one direction, it often pulls back slightly before continuing.
Traders enter when price pulls back to a previous support or resistance level. Have you noticed how prices often retrace before continuing a trend?
If you are using pullbacks, traders can catch the trend at a better entry point. These setups often align with swing trading, where price action patterns guide entries and exits over several days.
Inside Bar Strategy
Inside bars are candlestick patterns that form within the range of the previous bar. This strategy looks for a breakout after an inside bar forms.
Traders expect price to break out in the direction of the previous trend. Can you spot inside bars on your charts?
They can indicate a period of consolidation before price makes a move.
Pin Bar Strategy
Pin bars are candlestick patterns that show strong rejection of a price level. They have long wicks and small bodies.
The pin bar strategy involves trading when a pin bar forms at key support or resistance levels. Do you watch for pin bars as potential reversal signals?
They often signal that price will reverse direction.
Trend Reversal Strategy
The trend reversal strategy focuses on spotting when a trend is about to change direction. Traders look for signs like candlestick patterns, key support and resistance breaks, or divergence.
Moreover, recognizing a trend reversal early can be very profitable. Have you ever caught a trend reversal before others?
This strategy requires good timing and experience. Many bearish reversals are fueled by short selling, where traders bet on declining prices, intensifying downside momentum in the price action.
These strategies all rely on reading price movements. The key is understanding how price behaves at key levels and patterns. Would you like to try any of these strategies in your trading?
Popular Price Action Patterns
Penny stocks show price-action patterns at extreme volatility, see how to trade penny stocks for the high-risk version of these setups.
Price action traders rely on specific patterns to predict future price movements. These patterns signal potential trend reversals or continuations. Let’s explore some of the most popular ones, backed by statistics and real examples.
The Head and Shoulders pattern is one of the most well-known reversal patterns. According to a study by Bulkowski (2005), the head and shoulders pattern has an average success rate of 85% when confirmed by a breakout.
The pattern forms after a trend and shows three peaks, a higher peak (head) between two smaller peaks (shoulders). Traders often wait for the price to break below the neckline in a bearish scenario, or above it in a bullish scenario.
In a real-world example, the EUR/USD pair exhibited a head and shoulders pattern in early 2020, which marked the transition from an uptrend to a downtrend.
The Double Top and Double Bottom patterns also signal trend reversals. A double top forms after an uptrend and shows two peaks at the same price level.
It has been found that the average reliability of a double top pattern ranges from 60% to 80%, depending on market conditions (Nison, 2001). If the price fails to break above the resistance and falls below the neckline, a bearish reversal is likely.
Conversely, the double bottom pattern suggests a reversal to an uptrend. For example, in 2020, the USD/JPY pair showed a double bottom pattern that indicated a price reversal from a downtrend to an uptrend.
Triangles are another popular pattern, often indicating continuation. They come in three types, ascending, descending, and symmetrical.
According to research by Thomas Bulkowski, ascending triangles have a success rate of around 75%, while symmetrical triangles have a lower success rate of around 50%. The symmetrical triangle pattern appeared on the GBP/USD chart in late 2022, and after the breakout, the price continued in the direction of the trend.
Traders use this pattern to anticipate a breakout once the price reaches the apex. Occasionally, those breakouts occur as price gaps, sudden voids on the chart that offer unique setups explored in gap trading.
Flags and Pennants are continuation patterns formed after a strong price move. Flags have a rectangular shape, while pennants resemble small triangles.
According to a study published in the Journal of Technical Analysis, flags and pennants have an average success rate of 65%. An example of a flag pattern occurred in 2019 with the S&P 500 index, where the price formed a flag after a sharp rally.
Once the price broke above the flag’s resistance, the uptrend continued.
Advantages and Disadvantages of Price Action Trading
| Advantages | Disadvantages |
| Price action trading relies solely on price data, so traders don’t need to use any technical indicators. | It can be difficult to master, especially for beginners, due to the complexity of interpreting price movements. |
| The price charts used are simple and easy to read, making them accessible to many traders. | Different traders may interpret the same price action differently, leading to conflicting decisions. |
| This strategy works well in any market, including forex, stocks, and commodities. | Price action can sometimes provide false signals, leading to losses if not properly analyzed. |
| It eliminates reliance on lagging indicators and focuses on current market prices, providing a clearer picture of market conditions. | Price action trading is less reliable in markets with low volatility or unpredictable movements. |
| Traders can manage risk better by using stop-loss and take-profit levels based on market behavior. | Price action trading focuses only on price and doesn’t consider news events or other fundamental factors that might affect the market. However, in highly volatile environments such as penny stock trading, price action can reveal sharp speculative surges even without fundamental drivers. |
| Unlike many other trading systems, price action trading doesn’t require expensive subscriptions or indicators. | Traders might be influenced by their emotions while interpreting price patterns, leading to poor decisions. |
How to Get Started With Price Action Trading?
If you are starting with price action trading is simple. Follow these steps to begin your journey:
1. Learn the Fundamentals
You need to understand key concepts like candlestick patterns, support and resistance levels, and trends. These are essential when analyzing price movements. Can you spot trends and key levels? See, these concepts will give you a solid foundation in price action trading.
2. So, choose a Charting Platform
Pick a charting platform that suits you. TradingView and MetaTrader 4 are good options. You should use them to view the price data clearly. A simple, clean chart helps you focus on price movements, not distractions.
3. Practice on a Demo Account
Open a demo account with your broker. You can practice trading without risking any real money. Why not take advantage of this opportunity? You should use the demo account to get comfortable and sharpen your skills.
4. Learn to Identify Price Patterns
Focus on understanding key price action patterns. Look for breakouts, reversals, and consolidations. So, these patterns help you make informed decisions. Patterns like pin bars or engulfing candles tell you a lot about market movement.
5. Manage Your Risk
Set stop-loss orders on every trade. This limits your potential loss if the market moves against you. Advanced traders also monitor after-hours stocks to gauge overnight volatility that could affect stop-loss levels or open positions.
Risk management is important. Never risk more than 2% of your capital on one trade. Do you have a strategy to protect your capital?
6. Stay Patient and Disciplined
Patience is key in price action trading. Wait for clear trade setups before jumping in.
Stick to your trading plan and avoid impulsive moves. Consistency is the path to success.
Can you stay disciplined in your trades?
7. Keep Learning
Trading is a journey of continuous learning. Study successful traders and read their strategies. The more you learn, the better you’ll get. Join forums or trading communities to exchange knowledge.
Turn Knowledge into Profit
You have done the reading, now it is time to act. The best way to learn is by doing. Open a free, no-risk demo account and practice your strategy with virtual funds today.
Open a Free Demo AccountFinal Thoughts
Price action trading offers a simple yet powerful way to approach the markets. It focuses purely on price movement, which avoids the need for complex indicators.
Are you ready to explore this method and gain an edge? The beauty of price action lies in its simplicity.
You observe the price and respond. Anyone can learn it with time and practice.
The key is consistency. Trading takes time.
It’s not about instant success. You’ll improve as you practice and adapt to the market.
Stick to your plan and manage risk effectively.
Have you started applying price action strategies in your trades yet? The more you practice, the more comfortable you’ll feel.
The process might seem slow, but progress is inevitable. Keep refining your strategy.
Are you ready to dive deeper into price action trading? If so, start small, stay disciplined, and observe how the market moves.
The rewards will follow as you grow your skills.
FAQs
What our analysts watch: Three structures dominate any clean price action read. Higher-highs and higher-lows (or the inverse) confirm the directional regime; once that breaks, the prior trend is in question regardless of indicators.
Pin bars, engulfing candles, and inside-bar breakouts at established support or resistance signal participation rather than noise. Volume on the breakout confirms whether the move is real or a thin-tape head fake.
When all three align with the macro context, the setup is high-conviction; when they diverge, we wait.
Volity operates a trading platform and also publishes educational and analytical content about trading. The content on this page is for educational purposes only and should not be considered financial advice. Volity may benefit commercially when readers open trading accounts through links on this site.
Our content is produced and reviewed under documented editorial standards; comparison and review methodology is published here.