Bonds carry hidden interest-rate risk, a 4.57% yield on a 10-year Treasury can evaporate instantly if inflation expectations spike; a 1% rate increase causes a 15-20% price decline in long-duration bonds, erasing years of coupon income in weeks. Credit risk means corporate bonds carry hidden default risk; when markets panic, spreads blow out 200+ basis points, turning “investment grade” 5% bonds into 8%+ yielding distressed securities overnight. Tokenized bonds (RWA) carry smart-contract bugs and regulatory uncertainty; the $15 billion market can liquidate 50%+ if regulators challenge the GENIUS Act’s legal framework. Past performance is not indicative of future results. Capital at risk.
Bonds identify a debt-based financial instrument where an investor loans capital to a government or corporation for a defined period at a fixed or variable interest rate. In 2026, the bond market has undergone a structural reset, with the 10-year Treasury yield stabilizing at 4.57% and the rise of tokenized “Real World Assets” (RWA) providing 24/7 liquidity for Treasury bills. By understanding the inverse relationship between interest rates and bond prices, investors can utilize fixed income to preserve capital, generate predictable cash flow, and diversify away from the high concentration risk of 2026 equity markets.
While understanding Fixed Income Frameworks is important, applying that knowledge is where the real growth happens. Create Your Free Forex Trading Account to practice with a free demo account and put your strategy to the test.
What are bonds and why invest in them today?
Bonds are debt instruments that represent a loan from an investor to an issuer, identifying a contract for periodic interest payments and the return of principal at maturity. This mechanism creates predictable cash flows for retirees and risk-averse investors seeking steady income rather than growth volatility. Lending vs. Owning reveals the critical distinction: bondholders are “Creditors” with legal claims on assets, while stockholders are “Owners” with residual claims after creditors are paid.
Predictable Income comes from the “Coupon,” the annual interest payment expressed as a percentage of face value, a 4.57% Treasury coupon pays $45.70 per year on a $1,000 bond. Portfolio Ballast explains how bonds reduce the total standard deviation of a 60/40 portfolio by 30-40% compared to stocks alone, when equities fall, bonds often rise or hold steady. In 2026, the 10-year U.S. Treasury yield benchmarks at 4.57%, its highest sustained level in over a decade, identifying a structural shift toward “Higher for Longer” yields (Macrotrends Data, 2026).
The Inverse Relationship: Bond Prices vs. Interest Rates
Interest rate sensitivity identifies the inverse correlation between market rates and bond prices, where rising rates force the value of existing bonds to decline. This mechanism means a bond purchased at 4.57% loses value if new bonds become available at 5.57%, investors must sell their older, lower-yielding bonds at a discount. Duration Risk explains why long-term bonds are more volatile: a 30-year Treasury is 10x more sensitive to rate changes than a 3-month T-Bill.
Ready to Elevate Your Trading?
You have the information. Now, get the platform. Join thousands of successful traders who use Volity for its powerful tools, fast execution, and dedicated support.
Create Your Account in Under 3 MinutesGovernment vs. Corporate Bonds: Risk and Reward
Issuer classification identifies the level of credit risk and potential yield an investor can expect, ranging from sovereign-guaranteed Treasuries to high-yield corporate debt. U.S. Treasuries remain the “Risk-Free” standard at 4.57% for 10-year maturities, the U.S. government’s full faith and credit backs repayment. Municipal Bonds offer tax-exempt income for state and local infrastructure, a 5% municipal bond is worth more than a 5% Treasury if your tax bracket exceeds 40%.
Corporate Investment Grade covers companies with strong balance sheets yielding 5.0% – 6.5%, these are rated BBB or higher by S&P, indicating low default probability. High-Yield (Junk) bonds offer 8% – 14% to compensate for default risk, emerging growth or distressed firms require higher yields to attract investors. Investment-grade corporate credit spreads remain historically low at 78 basis points in 2026, identifying high institutional confidence in corporate earnings despite 3.5% Fed rates (Schwab Market Analysis, 2026). Bonds vs Stocks explains the risk-return tradeoff between these asset classes.
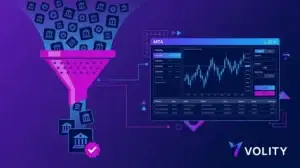
The Rise of Tokenized Treasury Bills (RWA)
RWA tokenization identifies the 2026 breakout of digital Treasury bills, which utilize blockchain rails to provide 24/7 liquidity and atomic settlement. This innovation removes banking intermediaries and settlement delays, enabling institutions to earn 4.5% yields on-chain instantly. The $15 Billion Milestone shows how tokenized U.S. debt has grown 10x since 2024, with institutional funds like BlackRock’s BUIDL leading adoption.
GENIUS Act Clarity provided the landmark 2026 law that recognized on-chain records as legal titles of ownership, banks now treat blockchain records as official certificates of bond ownership, accelerating settlement. Top Funds include BlackRock (BUIDL) and Franklin Templeton (FOBXX) as the primary digital bond vehicles, both offering institutional-grade Treasury access. Real trading example: A corporate treasurer required a 4.5% yield on $10 million in idle cash but needed the ability to withdraw it on a Sunday afternoon in April 2026. The treasurer utilized a tokenized RWA platform, earning the Treasury yield while maintaining 24/7 “Atomic” liquidity, identifying a primary improvement over the 48-hour banking lag. Past performance is not indicative of future results.
2026 Bond Market Benchmarks: Yields and Spreads
Yield benchmarks identify the current compensation levels for various durations and credit ratings in the 2026 upward-sloping yield curve environment.
| Bond Type | 2026 Yield (May) | Credit Spread (bps) | Maturity Term | Risk Tier |
| 3-Month T-Bill | 3.69% | N/A | Short | Zero-Risk |
| 10-Year Treasury | 4.57% | N/A | Medium | Zero-Risk |
| 30-Year Treasury | 5.04% | N/A | Long | Inflation |
| Corporate (AAA) | 5.35% | 78 bps | 10-Year | Low-Risk |
| High Yield (BB) | 9.42% | 485 bps | 5-Year | Speculative |
Sources: Data compiled from Macrotrends Yield History and Stashfin Bond Benchmarks (2026).
The Stock-Bond Correlation Shift in 2026
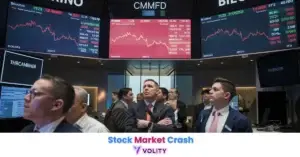
Correlation regimes indicate whether bonds will act as a ‘ballast’ to diversify stock market losses or as an ‘accelerator’ during inflationary shocks. Normalizing Correlation reveals why the 2026 shift toward negative correlation is reviving the 60/40 portfolio, bonds and stocks are starting to move in opposite directions again after years of synchronized declines. Fiscal Pressure shows how massive government debt supply ($2 trillion deficit) is keeping long-term yields “sticky” despite Fed rate pauses.
Bonds vs. Gold identifies which asset provides the superior hedge during the 2026 energy volatility, bonds defend against deflation while gold protects from fiat devaluation. Inflation Protection teaches strategies for weathering price spirals using inflation-linked securities.
Turn Knowledge into Profit
You have done the reading, now it is time to act. The best way to learn is by doing. Open a free, no-risk demo account and practice your strategy with virtual funds today.
Open a Free Demo AccountStep-by-Step: How to Invest in Bonds and Bond ETFs
Investment execution represents the final step in building a fixed-income core, requiring a choice between individual bonds and low-cost ETFs. Individual Bonds allows using TreasuryDirect.gov for zero-fee direct purchases, you can buy Treasury securities directly from the U.S. government without paying broker commissions. Bond ETFs provide instant diversification by tracking broad indices: AGG (Aggregate) covers all bonds while TLT (Long-Term) focuses on duration-heavy securities.
Bond Ladders involve building a sequence of maturities (1-year, 2-year, 3-year bonds) to manage reinvestment risk and provide steady maturity dates when you need capital. What are Indices explains how bond indices aggregate thousands of securities into single benchmarks. Portfolio Rebalancing ensures your bond allocation stays at target (e.g., 40% in a 60/40 portfolio) as bond values fluctuate.
Key Takeaways
- [Bonds] are debt-based investments where you lend money to an issuer in exchange for regular interest payments and principal return.
- [10-Year Treasury yields] have benchmarked at 4.57% in 2026, signaling a definitive return to “True Income” for diversified portfolios.
- [Tokenized bonds] (RWA) have reached a $15 billion market in 2026, providing institutional-grade Treasury access with 24/7 liquidity.
- [The yield curve] is currently steepening in 2026, transitioning from a historic inversion to a normal upward-sloping price structure.
- [Interest rate risk] is the primary danger for bondholders, as rising rates cause the market value of existing bonds to fall significantly.
- [Corporate credit spreads] remain low at 78 basis points, identifying strong investor confidence in the balance sheets of blue-chip leaders.
Frequently Asked Questions
This article contains references to What are Bonds and Volity, a regulated CFD trading platform. This content is produced for educational purposes only and does not constitute financial advice or a recommendation to buy or sell any financial instrument. Always verify current regulatory status and platform details before using any trading service. Some links in this article may be affiliate links.