Pennant breakouts can be invalidated when institutional liquidity sweeps extend beyond the pattern’s apex, causing stops to be triggered on false breakout signals. The consolidation phase duration is subjective, and patterns lasting beyond 4 weeks lose their momentum “energy” and often reverse instead of continuing. High-velocity spikes that break pennant trendlines without volume confirmation are frequently algorithmic traps that reverse within hours. Entering pennant trades during low-liquidity sessions (Asian overnight) exposes traders to extreme slippage on breakout execution. Past performance is not indicative of future results. Capital at risk.
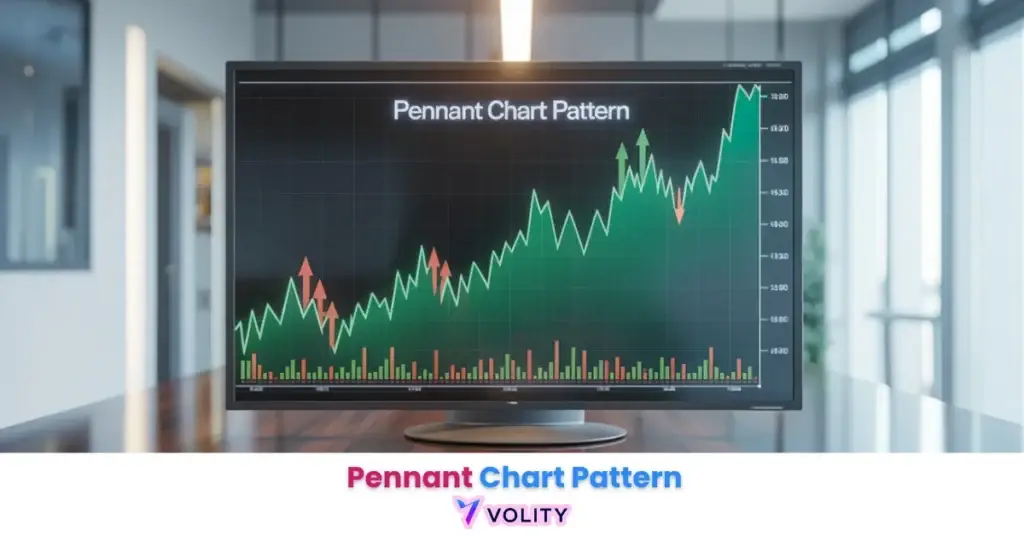
The pennant chart pattern is a short-term continuation signal that forms when an impulsive price move, the flagpole, is followed by a brief period of consolidation within converging trendlines. In 2026, this formation is a primary tool for trend followers to enter high-momentum moves after a temporary pause. The pattern’s validity is confirmed by a significant surge in volume upon the breakout, typically leading to a secondary price move equal in length to the initial flagpole.
The pennant chart pattern functions as a reliable roadmap for navigating high-velocity market trends. This formation identifies the specific points where traders “catch their breath” before initiating a secondary wave of buying or selling pressure. Learning how to read forex charts and identifying the converging trend-line structure is essential for mastering this pattern. It serves as an essential component of any momentum-based trading system.
The 2026 investment landscape emphasizes the importance of volume-confirmed breakouts to avoid the “chop” of retail-driven consolidation zones. Mastering the structural relationship between the flagpole and the pennant body allows investors to execute trades with high precision and objective risk parameters.
While understanding Pennant Chart Pattern is important, applying that knowledge is where the real growth happens. Create Your Free Forex Trading Account to practice with a free demo account and put your strategy to the test.
What is a pennant chart pattern?
A pennant is a continuation chart pattern formed when price consolidates within converging trendlines following a strong directional impulse known as the flagpole.
The visual anatomy of a pennant consists of two essential components. The flagpole is the initial, near-vertical price move that establishes momentum and energy for the subsequent breakout. The pennant represents the triangular consolidation zone where neither buyers nor sellers dominate temporarily.
- The visual anatomy: The Flagpole (impulse) and the Pennant (symmetrical triangle)
- Duration: Why pennants are short-term (1-3 weeks) vs. triangles (months)
- Psychological significance: Temporary profit-taking before trend resumption
Pennants belong to the wider chart pattern family, and sit beside the flag as one of the two short continuation shapes that follow a sharp impulse rather than interrupt a drifting range.
Bullish vs. Bearish Pennants
A bullish pennant identifies an upward continuation after a rally, while a bearish pennant signals a downward continuation after a sharp decline.
Identification requires examining the preceding trend first. A bullish pennant can only form after an uptrend, with the flagpole reaching new highs. A bearish pennant requires a downtrend, with the flagpole reaching new lows. The consolidation that follows provides a brief reprieve before the trend resumes its original direction.
Ready to Elevate Your Trading?
You have the information. Now, get the platform. Join thousands of successful traders who use Volity for its powerful tools, fast execution, and dedicated support.
Create Your Account in Under 3 MinutesIdentifying the Flagpole and Converging Trendlines
Accurate pennant identification requires a near-vertical flagpole and two symmetrical trendlines that converge toward an apex.
Measuring the flagpole uses the “body close” to define the start and end of the impulse, ensuring the measurement reflects actual price movement rather than wicks. The pennant body demonstrates lower highs and higher lows that create the triangular shape. Volume must decline during the consolidation phase, confirming that traders are taking a temporary pause rather than reversing.
The cleaner the proportions, the more useful the pattern: a flagpole that clearly dominates the consolidation is what separates a genuine pennant from ordinary sideways drift.
How to trade pennant breakouts in 2026?
Successful pennant trading strategies utilizes volume expansion and pole projection to define entry triggers and profit objectives. A valid Breakout must be accompanied by a clear surge in participation.
Entry timing requires discipline and confirmation. Traders enter on the close of the breakout candle when price closes decisively above (for bullish) or below (for bearish) the upper or lower trendline. Volume must expand by at least 1.5x the 20-session average to confirm that institutional buyers or sellers have arrived.
Stop-loss placement uses the lowest point of a bullish pennant or highest point of a bearish pennant as the invalidation level. Setting stops slightly beyond these extremes (5-10 pips for daily charts) accounts for liquidity sweeps without excessive protection width that harms the risk-reward ratio.
Worked example, to show the arithmetic rather than to describe a trade that happened. Suppose a market rallies 5,000 points into a flagpole, then consolidates and breaks out of the apex at 80,000 on volume well above its 20-session average. Projecting the 5,000-point pole from the breakout puts the measured target at 85,000, and the stop sits below the pennant’s low. Entry, stop and target all come from the structure. Past performance is not indicative of future results.
Comparison: Pennant vs. Flag vs. Symmetrical Triangle
The shape of the consolidation and the presence of an impulse leg identifies the technical distinction between these common chart patterns.
| Component | Pennant Pattern | Flag Pattern | Symmetrical Triangle |
| Shape | Symmetrical Triangle | Rectangle/Parallelogram | Symmetrical Triangle |
| Flagpole | Required (Vertical) | Required (Vertical) | Optional/Absent |
| Trendlines | Converging | Parallel | Converging |
| Duration | 1-3 Weeks (Short) | 1-3 Weeks (Short) | 3-12 Weeks (Medium) |
| Target Method | Pole Projection | Pole Projection | Triangle Height |
Unlike the rectangle chart pattern, which shows parallel boundaries, the pennant reflects narrowing indecision. The reference description of both the pennant and its parallel-sided cousin is the flag and pennant patterns entry.
Pennants work best when the flagpole is crisp and vertical, confirming rapid momentum. Flags contain parallel trendlines, indicating a more orderly retreat. Symmetrical triangles form without a preceding impulse, making them less reliable continuation signals than pennants.
Avoiding False Signals: The Volume Filter
Volume expansion determines the validity of a pennant breakout and identifies institutional participation in the continuation move. Applying rigorous Risk Management protocols helps traders survive the inevitable whipsaws that occur in volatile markets.
The “V-Shape” volume profile shows high activity at the pole, declining volume in the pennant body, and then surging volume at the breakout. The 20-session volume average serves as the benchmark for expansion measurement. When volume remains flat or decreases during a “breakout,” it signals a liquidity trap. Learning how to trade fakeouts is essential for avoiding these institutional traps.
Timeframe matters as much as shape. A pennant on a 15-minute chart is far more exposed to intraday noise and scalper activity than the same shape on a daily chart, which is why higher timeframes are the sensible place to learn the pattern.
Turn Knowledge into Profit
You have done the reading, now it is time to act. The best way to learn is by doing. Open a free, no-risk demo account and practice your strategy with virtual funds today.
Open a Free Demo AccountPsychology and Mindset for Trend Following
Emotional discipline ensures that traders do not enter a pennant trade prematurely before the objective breakout confirmation occurs.
FOMO (Fear of Missing Out) kills many potentially successful trades when traders enter inside the pennant body before the trendline breaks. The pattern may complete successfully in hours, but early traders accumulate losses as price reverses back into the consolidation zone. Adhering to the “measured move” target in volatile 2026 markets requires trusting the pole projection, not adding positions when excitement builds during breakout candles.
Key Takeaways
- Pennant chart patterns are short-term continuation signals that identify a brief consolidation before a strong trend resumes.
- The Flagpole is the initial, near-vertical price move that provides the necessary energy for the secondary breakout.
- Converging trendlines distinguish pennants from flags, forming a small symmetrical triangle shape during the consolidation phase.
- Volume confirmation is mandatory for a valid breakout, with high-conviction signals showing a 1.5x surge on the breakout candle.
- Pole projection is the primary method for setting profit targets, calculated by adding the flagpole’s height to the breakout point.
- Higher timeframes such as daily and 4-hour charts offer significantly more reliable pennant signals by filtering out intraday noise.
Frequently Asked Questions
This article contains references to Pennant Chart Patterns and Volity, a regulated CFD trading platform. This content is produced for educational purposes only and does not constitute financial advice or a recommendation to buy or sell any financial instrument. Pennant pattern recognition is subject to false breakouts and liquidity sweeps that can result in significant losses. Always test pennant strategies extensively on demo accounts before committing real capital. Some links in this article may be affiliate links.