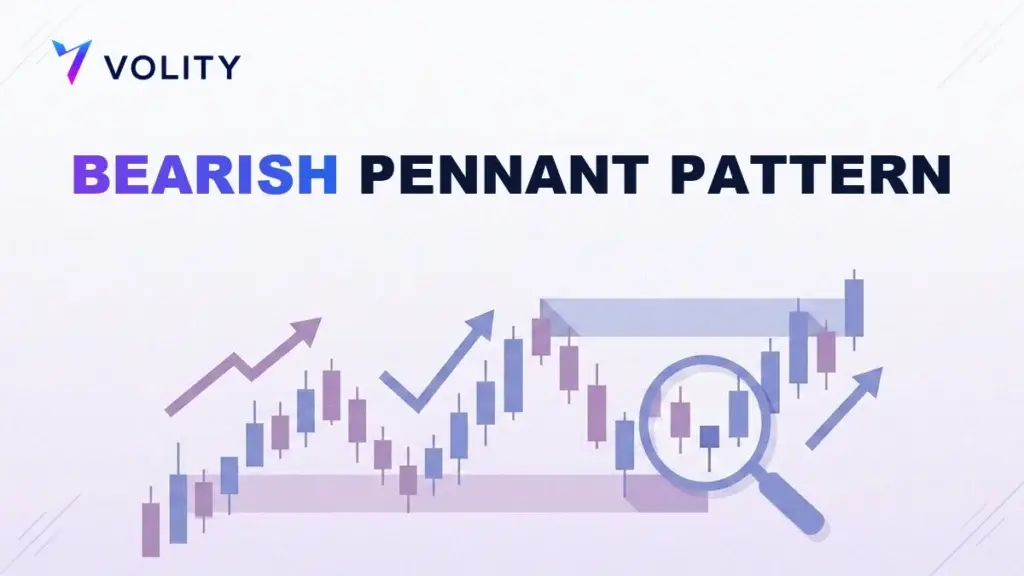
A bearish pennant is a continuation pattern that signals more downside is likely. It forms after a sharp fall, when price pauses in a small triangle of tightening consolidation before breaking lower again. Traders read it as a brief rest inside a strong downtrend and target a second leg down about the size of the first.

What is a bearish pennant pattern?
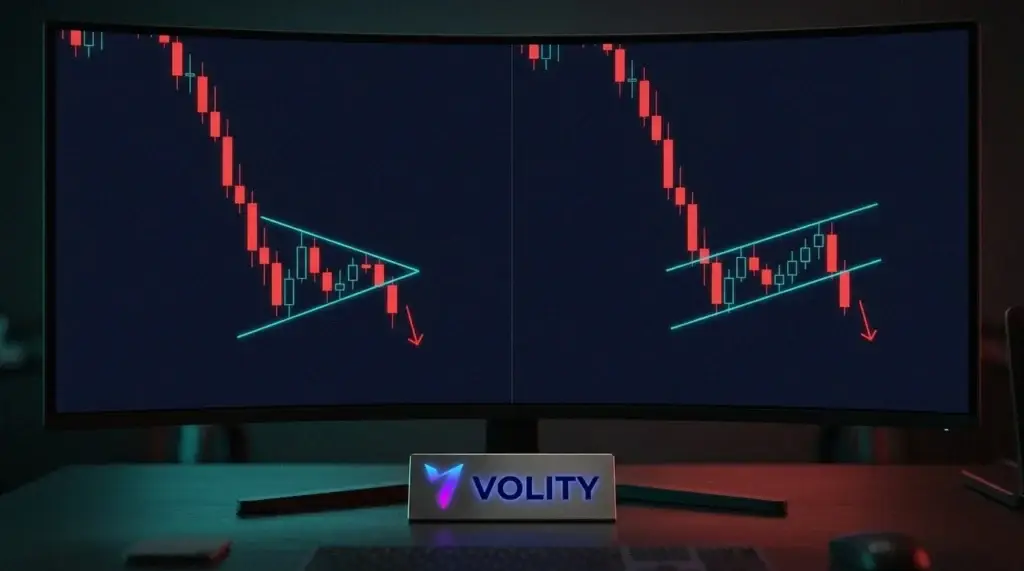
A bearish pennant has two parts. First comes the flagpole: a fast, near-vertical drop driven by heavy selling. Then comes the pennant itself, a short pause where the range narrows into a small symmetrical triangle, with lower highs and higher lows converging toward a point. Volume dries up during the pause, then expands again when price breaks out of the triangle to the downside.
The logic is straightforward. After a violent move down, some traders take profit and others try to pick a bottom, and that tug-of-war creates the tight, indecisive consolidation. The sellers who drove the flagpole are still in control, though. Once the weak bounce runs out of buyers, price resolves in the original direction and the downtrend continues. That is why flags and pennants are classed as continuation patterns rather than reversals.
Bearish pennant vs bearish flag: what is the difference?
The bearish pennant and the bearish flag are close cousins, and traders often use the names loosely. Both follow a flagpole and both point to continuation, but the shape of the consolidation differs.
| Feature | Bearish pennant | Bearish flag |
| Consolidation shape | Small converging triangle | Small parallel channel |
| Channel slope | Converging to a point | Usually sloping slightly up, against the trend |
| Trend before | Sharp drop (flagpole) | Sharp drop (flagpole) |
| Signal | Bearish continuation | Bearish continuation |
In practice the trade is the same. A bearish flag pattern consolidates inside two parallel lines that drift gently upward, while a bearish pennant squeezes into a triangle. Both break down to continue the move, and both project a target of roughly one flagpole length. The pattern statistics catalogued by Thomas Bulkowski treat them almost interchangeably, so if you can trade one you can trade the other. Just draw the consolidation lines that fit what price is actually doing.
How do you trade a bearish pennant?
Because the pattern is a pause in an existing move, the plan is to rejoin the trend when the pause ends. These five steps keep the entry disciplined and the risk defined.
- Confirm the flagpole first. Check that a sharp, high-volume drop came before the consolidation, because with no flagpole there is no pennant.
- Draw the pennant by connecting the lower highs and higher lows of the pause into a small triangle.
- Wait for a candle to close below the lower edge of the triangle, ideally as volume picks up, and treat that as your entry.
- Put the stop above the upper edge of the pennant, or above the last swing high inside it, so a clean reversal takes you out.
- Project the target by measuring the flagpole and subtracting that distance from the breakout point.
The measured move works because continuation patterns tend to repeat the momentum that created them, a method taught across the technical-analysis body of knowledge that bodies like the CMT Association maintain. Many traders bank partial profit at the projected target and trail the rest with a moving average, letting a strong downtrend carry the position past the minimum objective.
What does a bullish flag or bullish pennant look like?
Flip everything and you get the upside versions. A bullish flag pattern forms after a sharp rally: price consolidates in a small channel that drifts slightly downward, then breaks out upward to continue higher. A bullish pennant does the same with a converging triangle instead of a channel. Both are continuation patterns in an uptrend, mirroring their bearish counterparts.
Knowing the bullish flag and bullish pennant matters even when you are hunting shorts, because the difference between a bearish flag and a bullish flag comes down to direction and context. If the flagpole points up, you are looking at a bullish setup; if it points down, a bearish one. Read the flagpole first, then the consolidation, and the pattern names itself.
What makes a bearish pennant fail?
The main failure mode is a break in the wrong direction. If price exits the pennant upward instead of downward, the continuation thesis is void and the setup is done. A consolidation that drags on too long is another warning sign. A genuine pennant is a brief pause, so one that stretches into a wide, extended range has usually lost the momentum that gave the pattern its edge.
Volume is your confirmation filter. A clean bearish pennant shows falling volume through the consolidation and a clear expansion on the breakdown. When the break comes on thin volume, stay sceptical, because it is far more prone to reversing. As always, size the trade so a single failed pennant is a small, planned cost and not a serious loss.
Trading continuation patterns on Volity
Continuation patterns turn up on every market and every timeframe, so you want a platform that lets you trade them both ways. On Volity you can short a bearish pennant breakdown, or buy a bullish flag breakout, as a CFD on forex, indices, gold, commodities and crypto. Currencies suit the pattern well because they are among the deepest markets anywhere, with daily turnover measured in the trillions and the kind of liquidity and market structure that give clean, repeatable reactions. The Volity MT platform gives you the trendline and measured-move tools to map the flagpole and project the target, with execution regulated by CySEC through UBK Markets, licence 186/12.
Set the stop above the pennant, size the position to that distance, and apply leverage deliberately, up to 1:500 on selected forex pairs and 1:50 on crypto. Leverage magnifies losses as much as gains, which is why regulators such as the FCA and ESMA restrict how these products are sold to retail traders. Practise spotting flagpoles and consolidations on a demo account first, work through the wider trading education library, then trade live once the pattern is second nature. Full costs sit on the charges and fees page.
Related guides
Frequently asked questions
Is a bearish pennant a reversal or continuation pattern?
A bearish pennant is a continuation pattern. It marks a brief pause inside a downtrend before price resumes falling, unlike a reversal pattern that signals the trend is about to change direction.
How do you measure a bearish pennant target?
Measure the height of the flagpole, the sharp drop before the consolidation, then project that same distance downward from the breakout point. That gives the primary target, which you can bank partially and trail from.
What is the difference between a bearish flag and a bearish pennant?
A bearish flag consolidates in a small parallel channel that usually slopes slightly upward, while a bearish pennant consolidates in a small converging triangle. Both follow a flagpole and both break down to continue the trend, so they are traded the same way.
How long does a bearish pennant take to form?
Pennants are short-lived. On most timeframes the consolidation lasts only a handful of bars, typically one to three weeks on a daily chart. A consolidation that drags on much longer weakens the pattern and its momentum.