Forex technical analysis uses historical price patterns to predict future moves, but past patterns do not guarantee future price behavior. Technical signals can fail instantly when macroeconomic or geopolitical shocks override chart patterns, as happened repeatedly during major rate hikes and geopolitical crises in 2024-2025. AI-driven technical analysis does not eliminate human bias, it redistributes it into model training data. Relying solely on technical analysis without fundamental regime filters has destroyed thousands of accounts during unexpected central bank pivots. Capital at risk in all leveraged trading.
Forex technical analysis is the methodology of evaluating currency pairs based on past price movements and market statistics. This framework identifies repetitive patterns and trends to provide a probabilistic edge in the $9.6 trillion daily market. In 2026, technical analysis represents 42.1% of the global analysis software market, reflecting its critical role in modern algorithmic execution.
Forex technical analysis functions as a visual record of collective market psychology and institutional order flow. This technique allows traders to interpret exactly how price reacts at critical psychological levels through chart patterns and technical indicators. It serves as the primary gateway for mastering execution timing in the 2026 trading environment.
The 2026 investment landscape utilizes AI-driven “Co-Pilots” to filter market noise and identify high-conviction setups. Modern technicians integrate sentiment-weighted volume data and predictive liquidity maps to stay ahead of high-frequency institutional algorithms.
While understanding Forex Technical Analysis is important, applying that knowledge is where the real growth happens. Create Your Free Forex Trading Account to practice with a free demo account and put your strategy to the test.
What is forex technical analysis and how does it function?
Forex technical analysis is the systematic study of historical price action and volume to identify high-probability entry and exit zones. The core methodology rests on three foundational assumptions: first, that current prices discount all available information (the Efficient Market Hypothesis), second, that price movements follow identifiable and persistent trends, and third, that human psychology creates repetitive patterns visible on charts. Rather than analyzing economic data, technical analysts read the market’s own testimony, price itself.
Beginners often build this skill faster with a good reading list; our guide to the best books on forex trading shows how chart reading fits into a wider trading education.
The framework operates through the principle of market repetition: institutional traders accumulate positions at certain price levels, creating recognizable patterns that repeat across timeframes. When a support level breaks 100 times before failing, traders internalize that level’s “importance” and accumulate orders nearby. When price reaches that level again, the accumulated orders create predictable reactions, the self-fulfilling prophecy of technical analysis. The global technical analysis segment of the stock analysis software market is valued at $7.13 billion in 2026, representing a 42.1% total market share (DataIntelo, 2026).
- The Core Concept: Price discounts everything, all economic, political, and psychological information is embedded in current price levels
- Trend Persistence: Why history repeats itself through repetitive pattern cycles that compound across timeframes
- The 2026 Evolution: Shifting from “Lagging” to “Predictive” charting technologies that forecast liquidity zones before price interaction
The Anatomy of Market Repetition
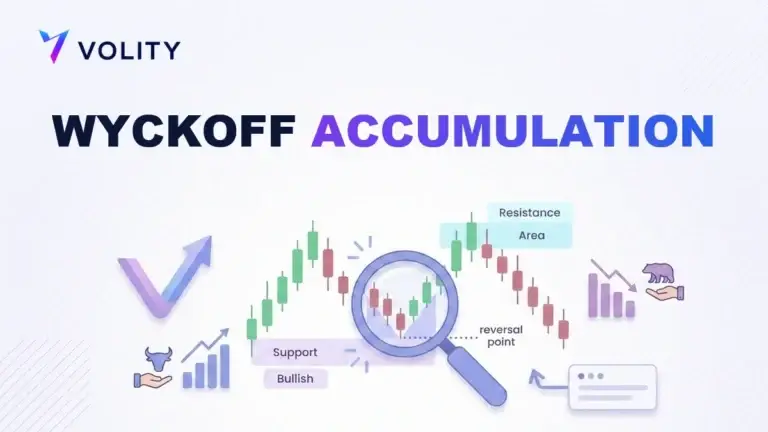
Chart patterns identifies the repetitive psychological reactions of market participants to specific price levels. Support levels act as price “floors” where buying demand accumulates; resistance levels act as “ceilings” where selling interest congregates. When price touches support 10 times without breaking, traders trust that level and place orders there, a self-fulfilling prophecy. When price finally breaks support on the 11th test, the sudden absence of buyers creates acceleration downward as stops cascade.
The psychology driving this repetition is fundamental: traders see a support level, know others see it, and know others know they see it, creating a cascade of aligned expectations. Fair Value Gaps (FVGs) and Order Blocks reveal where institutional traders left “footprints,” showing where they accumulated large positions. Modern 2026 technical analysis uses AI to identify these zones before price reaches them, a technique called Predictive Liquidity Mapping.
Ready to Elevate Your Trading?
You have the information. Now, get the platform. Join thousands of successful traders who use Volity for its powerful tools, fast execution, and dedicated support.
Create Your Account in Under 3 MinutesSteps to Executing Professional Technical Analysis
Systematic charting identifies the correct sequence of time-frame analysis and indicator confirmation required for an objective trade setup. Professional analysts follow a disciplined workflow: begin on the daily chart to identify the macro trend (up, down, or sideways), then drop to the 4-hour chart to find key reversal levels, then shift to the 1-hour chart for precise entry triggers. This top-down approach prevents the amateur mistake of trading against the macro trend simply because a lower timeframe shows a pattern.
Step 1 requires a market structure check on the higher timeframe, confirming whether the trend is up (higher lows and higher highs), down (lower lows and lower highs), or range-bound (bouncing between two prices). Step 2 involves identifying key levels: support zones where price bounced previously, resistance zones where price faced rejection, and Fair Value Gaps (FVGs) left behind when price gaps over supply/demand zones. Step 3 requires selecting a trigger pattern on the lower timeframe, perhaps a bullish engulfing candlestick or a wedge pattern, that aligns with higher timeframe structure.
Step 4 establishes indicator confluence: ensuring that at least two independent indicators (trend + momentum, or volume + volatility) confirm the setup. A bullish pattern without volume confirmation is high-risk; a bullish pattern with rising volume and RSI momentum creates a statistically robust setup. Modern 2026 cloud-native platforms now account for 60% of technical software deployment, growing at 9.4% annually (Precedence Research, 2026).
The Four Canonical Families of Technical Indicators
Indicator classification identifies the specific market dimension, trend, momentum, volume, or volatility, being measured by a mathematical formula. Professional traders rarely rely on a single indicator; instead, they use indicator families to confirm different market properties simultaneously. Trend indicators like Moving Averages and MACD measure whether price is moving up or down and at what acceleration. Momentum indicators like RSI and Stochastics measure whether the current trend is exhausted (overbought/oversold) or still healthy.
Volume indicators measure whether price moves are backed by strong participation (healthy) or sparse volume (weak). The On-Balance Volume (OBV) and Money Flow Index (MFI) track whether smart money (institutions accumulating large positions) or retail (panic selling/buying) are driving the move. Volatility indicators like Bollinger Bands and Average True Range (ATR) measure how much price is fluctuating, helping traders size positions appropriately.
Real trading example: In March 2026, EUR/USD price broke above a daily resistance level at 1.1500, confirmed by a rising OBV and a bullish MACD crossover on the 4-hour chart. The pair trended higher for 350 pips over the following two weeks as technical alignment attracted institutional momentum buyers. Past performance is not indicative of future results.
The integration of these four families prevents false signals: a trend indicator might show bullish momentum while the RSI shows overbought conditions, a warning that the move is exhausted. Conversely, trend + momentum + volume + volatility all aligning in the same direction signals an exceptionally high-conviction setup.
Benchmarking 2026 Technical Analysis Software
Software performance benchmarking identifies the capabilities of the leading 2026 technical analysis platforms for retail and institutional use. TradingView dominates retail adoption with its Predictive Liquidity Maps and AI Co-Pilot that provides natural language reasoning for every signal. MetaTrader 5 remains the industry standard for algorithmic traders, now featuring XAI (Explainable AI) that justifies each trade signal mathematically. NinjaTrader attracts professionals building complex strategy synthesis systems that combine multiple indicators into unified algorithmic trading rules.
| Platform | Target Audience | Cloud Native |
| TradingView | Retail | Yes |
| MetaTrader 5 | Mixed | No (Local) |
| NinjaTrader | Algorithmic | Partial |
| Bloomberg | Institutional | Yes |
| thinkorswim | Pro-Retail | Yes |
Bloomberg’s institutional-grade platform integrates macroeconomic sentiment and event risk directly into charting, allowing traders to see how geopolitical tensions shift technical patterns in real-time. thinkorswim’s volatility-aware indicators automatically adjust their sensitivity based on current market conditions, reducing false signals during choppy trading.
Limitations and Risks of Technical Analysis
Historical dependency indicates that technical patterns are not deterministic and can be invalidated by sudden macroeconomic or geopolitical shocks. The “lag” problem reveals a fundamental weakness: most technical indicators react to price movement after it occurs, meaning they measure past events rather than predicting future ones. An RSI reading above 70 signals overbought conditions, but price often continues rallying for 200+ more pips before reversing. A trader who shorted at “overbought” RSI 75 would be stopped out multiple times before the actual reversal.
Fundamental overlap creates a second failure mode: high-impact economic releases (NFP, CPI, rate decisions) create price spikes that ignore all technical patterns. A clean support level holds 50 times, then shatters in seconds when the Fed announces an unexpected rate hike. A trendline that predicted downside moves for six months breaks instantly when geopolitical risk triggers a flight-to-safety rally in the currency. Technical analysis alone cannot account for macro regime shifts.
Interpretation bias reveals the final danger: two experienced technicians can study the same chart and reach opposite conclusions. One sees support and expects a bounce; another sees a breakdown pattern and expects acceleration lower. This ambiguity is why modern traders require strict mechanical rules and AI confirmation, to eliminate the subjectivity that destroys accounts.
The Future of Analysis: AI Co-Pilots and Predictive Mapping
Predictive liquidity mapping represents the 2026 standard for identifying institutional order pockets before price interaction occurs. Rather than waiting for price to touch a support level and react, AI models now predict where the next accumulation zone will be by analyzing order book microstructure, funding flows, and historical patterns. A trader can see an empty liquidity pocket 200 pips away and position ahead of the eventual price move, a 10-year advantage captured in a single chart view.
AI Co-Pilots perform real-time behavioral bias correction: if a trader’s historical trading data shows they panic-sell winners too early, the AI recommends holding longer. If they over-leverage despite losses, the AI flags position sizing as excessive. Explainable AI (XAI) provides natural language reasoning, not just “BUY” signals, but explanations like “Volume Microstructure Divergence detected: aggressive selling at resistance while price holds, suggesting institutional accumulation before breakout.”
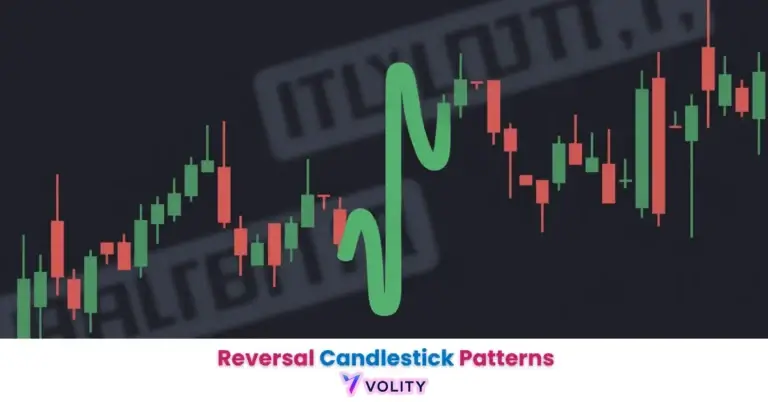
Sentiment-Weighted Technicals integrate real-time natural language processing of news flows directly into candlestick charts. The system reads every financial newswire in real-time, scores the sentiment (hawkish/dovish/neutral), and overlays that sentiment as a color gradient on the price chart. A green candle surrounded by red sentiment bars signals a potential fake-out: price moved up despite negative news, suggesting institutional buying.
Turn Knowledge into Profit
You have done the reading, now it is time to act. The best way to learn is by doing. Open a free, no-risk demo account and practice your strategy with virtual funds today.
Open a Free Demo AccountKey Takeaways
- Forex technical analysis is a systematic framework used to forecast price movements by evaluating historical price and volume data.
- Market efficiency is a core assumption, suggesting that current prices already discount all available economic and political information.
- The 2026 software market for technical analysis is valued at $7.13 billion, reflecting a massive shift toward AI-driven predictive tools.
- Predictive liquidity mapping is a 2026 standard that uses AI to identify institutional order pockets before price actually reaches them.
- Indicator confluence, combining trend and momentum signals, remains the most effective way to filter out high-frequency trading noise.
- Geopolitical risk premiums can invalidate technical patterns instantly, making real-time fundamental monitoring mandatory for 2026 traders.
Frequently Asked Questions
This article contains references to forex technical analysis, AI trading tools, and Volity, a regulated CFD trading platform. This content is produced for educational purposes only and does not constitute financial advice or a recommendation to execute any technical analysis strategy. Past performance is not indicative of future results, and technical patterns can fail during fundamental shocks. Always verify your trading software’s accuracy and maintain fundamental regime awareness when using technical signals. Some links in this article may be affiliate links.