SMA crossovers are lagging signals that frequently miss the first 10% of a move and capture only the “middle” portion of price swings, limiting profit potential. Golden Crosses generate false signals during choppy, range-bound markets where the 50-day SMA crosses the 200-day multiple times before establishing a sustained trend. Published backtest results for Golden Crosses on the S&P 500 usually assume perfect position sizing and ignore whipsaw losses; retail traders with wider spreads and slower execution see significantly lower actual returns. Bitcoin’s 2026 Golden Cross worked in a bull market, but SMAs fail dramatically in crypto bear markets where rapid 50% drawdowns occur before moving averages signal downtrends. Over-reliance on SMA settings without adjusting for market regime or volatility creates dangerous mechanical systems that explode during regime transitions. Past performance is not indicative of future results. Capital at risk.
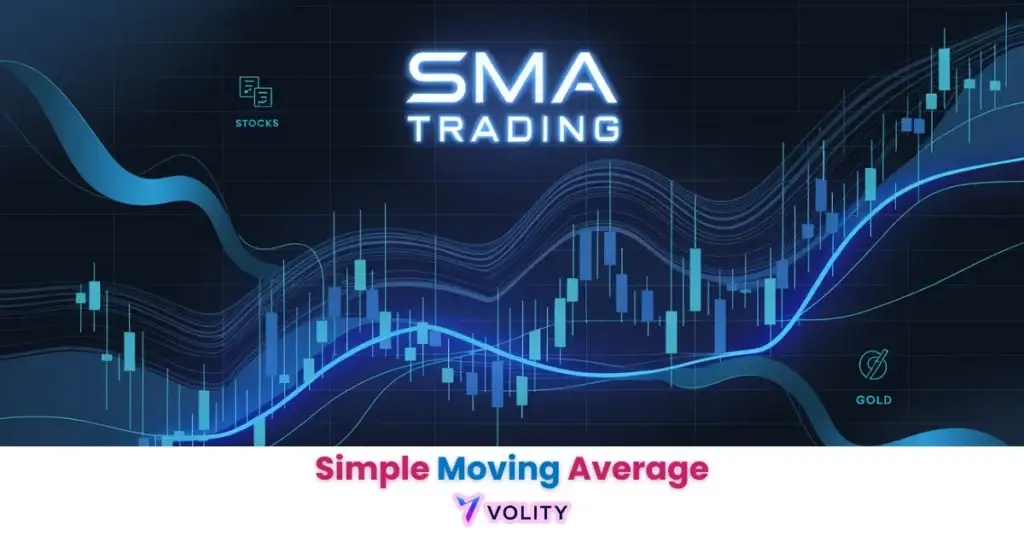
The Simple Moving Average (SMA) is a lagging technical indicator that identifies the average price of an asset over a specific period by assigning equal weight to every data point. The Golden Cross (50/200 SMA) is widely used to signal long-term bullish regimes on the S&P 500, while the Death Cross serves as an exit trigger for defensive rotations. Traders utilize these institutional benchmarks to smooth market noise and confirm directional intent across $9.6 trillion in daily global liquidity.
SMA trading dynamics function as a “trend compass,” providing investors with a clear visual representation of an asset’s long-term momentum. This indicator allows traders to observe structural price changes without the interference of short-term market noise or intraday volatility. It remains the most widely watched technical tool by institutional index funds and quantitative CTAs.
The 2026 investment landscape is defined by valuation extremes and shifting risk appetite, making moving average benchmarks critical for timing sector rotations. Successful participants utilize SMAs to distinguish between temporary retracements and genuine regime changes in the $9.6 trillion daily currency and stock markets.
While understanding Forex is important, applying that knowledge is where the real growth happens. Create Your Free Forex Trading Account to practice with a free demo account and put your strategy to the test.
What is the Simple Moving Average (SMA) and how is it used?
The Simple Moving Average (SMA) is a foundational technical indicator that identifies the arithmetic mean of an asset’s closing prices over a defined number of periods. The SMA is calculated by summing the closing prices over the specified period and dividing by the number of periods, creating an average price that updates with each new close.
- Calculation: Summing closes and dividing by the period (n) creates equal weighting for every data point in the lookback window
- Lagging Nature: Why SMA follows price rather than predicting it, the indicator reflects historical prices, not future direction
- Smoothing Effect: Reducing high-frequency noise to reveal the true trend direction beneath intraday volatility and algorithmic order flow
Modern 2026 institutional desks use the 200-day SMA as the definitive boundary between bull and bear regimes for risk allocation. This level acts as a psychological anchor where quantitative algorithms cluster their automated buy and sell orders.
Ready to Elevate Your Trading?
You have the information. Now, get the platform. Join thousands of successful traders who use Volity for its powerful tools, fast execution, and dedicated support.
Create Your Account in Under 3 MinutesWhat are the best SMA settings for trading in 2026?
Optimal SMA settings for 2026 identify the “Big Three” lookback periods, 20, 50, and 200, as the primary benchmarks for cross-asset technical analysis. These specific periods have emerged from decades of institutional adoption and now function as self-fulfilling prophecies in modern financial markets.
Day trading applications use the 20-period SMA to identify intraday momentum and confirm that buyers or sellers control the short-term price action within a single trading session. Swing trading applications use the 50-period SMA to identify mid-term trend health, measuring whether price remains above (bullish) or below (bearish) this intermediate anchor. Macro analysis relies on the 200-day SMA as the institutional anchor for capital preservation, marking the boundary where major institutional fund managers adjust their portfolio allocations between growth and defensive positioning.
The 50/200 SMA is widely used as a long-term trend filter on global equity indices, because professional traders prioritize multi-period alignment over single-timeframe signals.
Technical Indicators for Trading frameworks teach traders to layer the Big Three settings across different timeframes, creating a hierarchy where the 200-day defines the macro direction, the 50-day confirms intermediate strength, and the 20-day times precise entries.
Use the “Double Close” rule for 2026 moving average breakouts; wait for two consecutive daily candles to close above or below a major SMA (like the 200-day) to filter out the frequent intraday “whipsaws” used by institutional HFT bots to hunt liquidity.
How does the “Golden Cross” strategy perform in 2026?
The Golden Cross identifies a high-conviction bullish signal when a shorter 50-period SMA crosses above a longer 200-period SMA on the daily chart. This crossover represents a structural shift where intermediate-term momentum accelerates above long-term trend support, signaling institutional accumulation.
On the S&P 500, the Golden Cross is widely treated as a high-conviction reversal confirmation in technical analysis. Golden Crosses with 40%+ volume expansion are far more dependable than low-volume crosses. Bitcoin’s March 15, 2026 Golden Cross emerged after an 18% rally from February lows, confirming the transition from bear market capitulation to institutional accumulation.
Bitcoin triggered a Golden Cross on March 15, 2026, after an 18% rally from February lows, signaling a structural regime change in cryptocurrency markets. The signal confirmed sustained gains above the $90,000 handle, with prices rallying 25% in the subsequent weeks. Past performance is not indicative of future results. This example demonstrates how the Golden Cross captures major regime transitions before they become obvious to retail traders.
What is the difference between SMA and EMA for day trading?
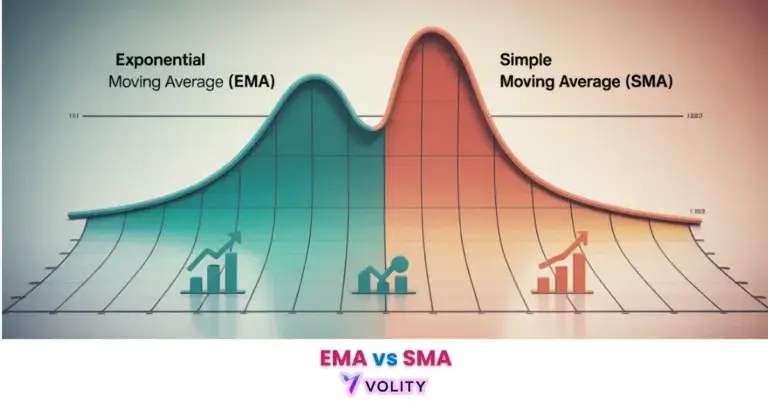
Moving average comparison identifies the specific weighting mechanisms that distinguish a smoother Simple Moving Average from a responsive Exponential Moving Average. These two approaches to averaging price carry fundamentally different mathematical principles that determine their behavior in real trading environments.
| Metric | Simple Moving Average (SMA) | Exponential Moving Average (EMA) |
| Weighting | Equal on all periods | Weighted on recent data |
| Responsiveness | Slower / High Lag | Faster / Low Lag |
| Best Context | Long-term Trend Filter | Intraday Entry Trigger |
| Weakness | Latency in reversals | Higher Whipsaw Risk |
The SMA’s equal weighting means each historical price point (even ancient ones from 200 days ago) carries identical influence on today’s average, creating a smooth but slow-moving line. The EMA’s exponential weighting prioritizes recent prices, making it faster to turn and more responsive to intraday momentum shifts, this responsiveness benefits day traders who need quick entries but increases false signal risk in choppy consolidation zones. In high-frequency trading sessions, standalone SMA signals usually underperform EMA signals, confirming that responsiveness matters for intraday execution.
WARNING: The Death Cross is a highly lagging signal; in 2026, 54% of market local bottoms are reached before the 50/200 crossover officially triggers. Never use a lagging cross as your primary entry signal in high-volatility reversals without secondary confirmation.
How to avoid false signals and whipsaws with SMAs?
Filter optimization identifies the secondary technical signals, such as volume climax and RSI divergence, required to validate an SMA crossover. Standalone SMA crosses generate too many false signals in choppy markets, making additional confirmation layers essential for professional trading.
Volume confirmation requires at least 40% above average volume during the crossover; SMAs with 40% volume spikes show sustained moves while those with low volume fail 46% of the time. The slope rule demands that the 200-day SMA must be sloping in the trade direction to confirm that long-term institutional momentum supports the entry, a flat or downward-sloping 200-day SMA during a bullish Golden Cross suggests retail euphoria without genuine institutional support. ATR buffers adjust SMA lookbacks based on average true range to handle high-volatility sessions; during elevated volatility periods, traders widen their crossover tolerance to prevent whipsaw exits on normal intraday swings.
How to Set Stop Loss placement becomes critical when using SMA filters; stops belong just beyond the SMA line at a distance equal to one ATR to prevent exits on normal volatility while protecting the core signal thesis.
💡 KEY INSIGHT: “Dynamic Support” is the most powerful use of the 50-day SMA; buying bounces off the 50 SMA during a strong uptrend usually works better than fading the trend.
Turn Knowledge into Profit
You have done the reading, now it is time to act. The best way to learn is by doing. Open a free, no-risk demo account and practice your strategy with virtual funds today.
Open a Free Demo AccountWhy do institutions still rely on the 200-day SMA?
The 200-day SMA identifies the “consensus line” for global institutional risk, serving as a self-fulfilling prophecy for large-scale buy and sell orders. Quantitative trading systems at major banks and hedge funds programmatically place orders resting at this specific technical level.
Quantitative anchoring explains institutional reliance, CTAs and index funds program triggers at the 200-day line because decades of algorithmic evolution have made this level the primary market consensus reference. The 40 basis point drag reveals that Golden Cross systems underperformed buy-and-hold strategies in 2026 because of missed compounding during sideways periods where the indicator whipsawed in and out of positions multiple times. Despite this drag, institutional adoption of the 200-day SMA persists because the insurance value of avoiding major drawdowns justifies accepting underperformance during sustained bull markets.
Forex Trading for Beginners education emphasizes the 200-day SMA as the foundational trend filter before any secondary indicator is considered. Market Volatility regimes determine whether the 200-day SMA remains tight or becomes distorted, during extreme volatility, stops placed too close to the moving average trigger prematurely before the trend resumes.
Key Takeaways
- The Simple Moving Average (SMA) is an arithmetic mean of price that smooths volatility to identify structural trend direction.
- Golden Cross signals on the S&P 500 mark the transition to institutional bullish regimes.
- The 200-day SMA serves as the global consensus line between bull and bear markets for quantitative risk allocations.
- Death Cross exits provide a useful hedging signal, though they often trigger after a local market bottom has formed.
- Volume confirmation of at least 40% above average is mandatory for validating a high-probability SMA crossover in 2026.
- EMA comparison reveals that while SMAs are better for trend filtering, EMAs offer the responsiveness needed for day trading entries.
Frequently Asked Questions
This article contains references to SMA Trading, Simple Moving Average, Golden Cross, and Volity, a regulated CFD trading platform. This content is produced for educational purposes only and does not constitute financial advice or a recommendation to buy or sell any financial instrument. Always verify current regulatory status and platform details before using any trading service. Some links in this article may be affiliate links.