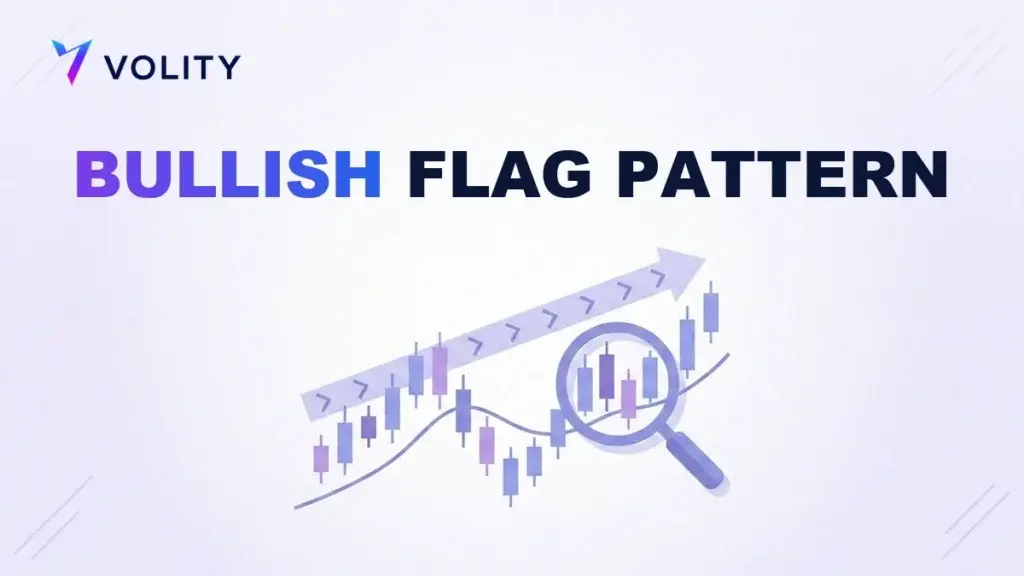
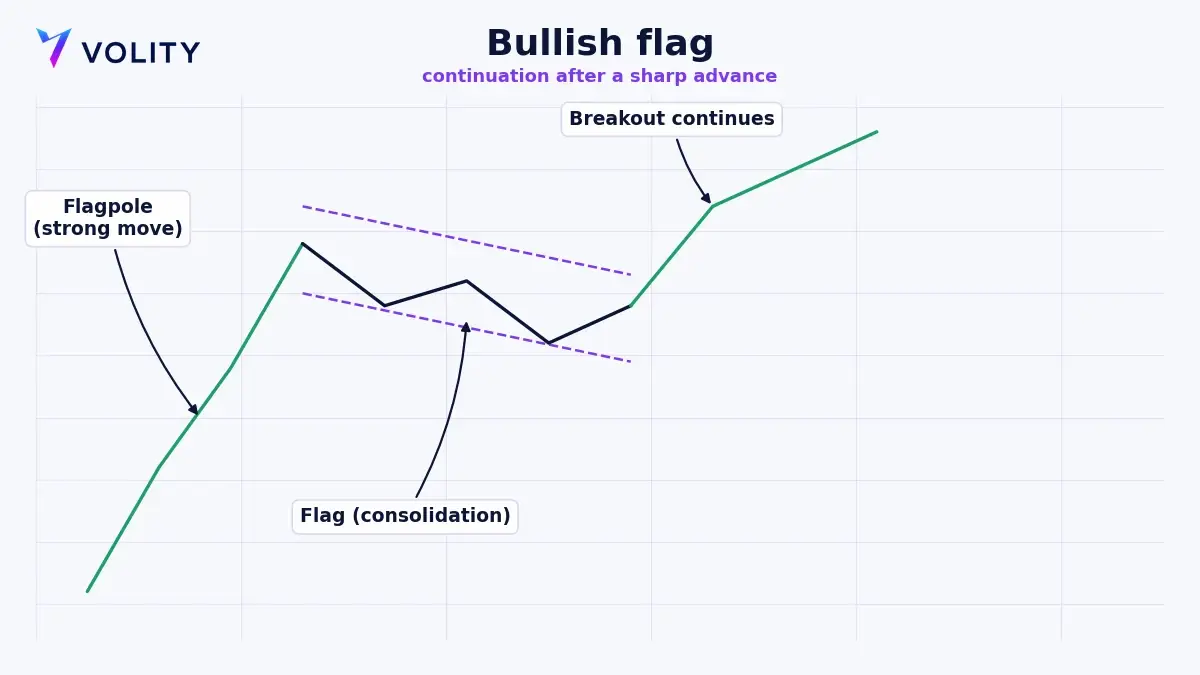
The bullish flag pattern is a continuation signal that appears during an uptrend. It has two parts: a sharp rally called the flagpole, followed by a short, slightly downward consolidation called the flag. When price breaks above the flag, the uptrend usually resumes. The pattern marks a pause inside a strong move, and the trend tends to continue afterwards.
What is a bullish flag pattern?
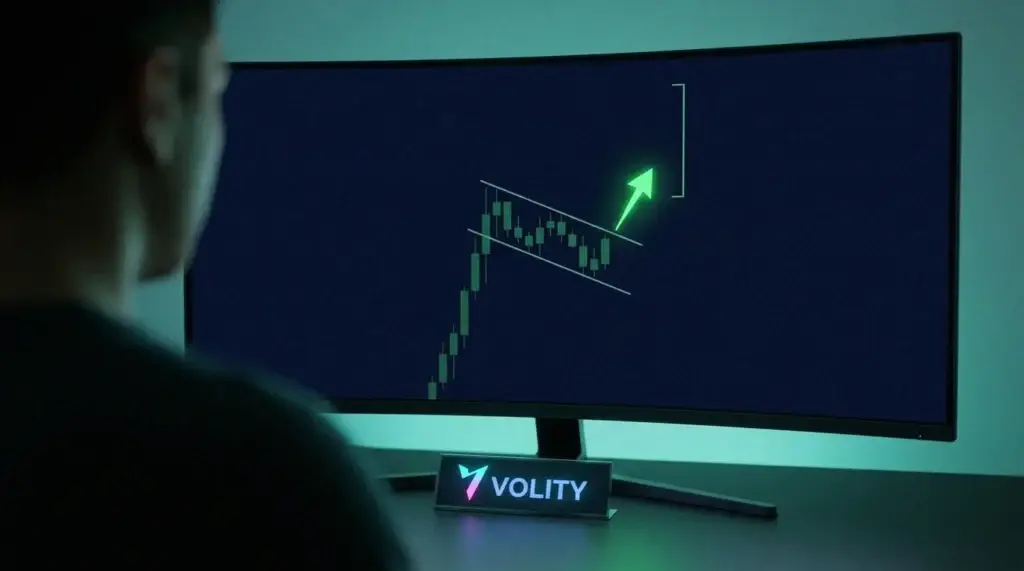
A bullish flag, also known as a bull flag, is a short-term continuation pattern with two clear components, and recognising both is what separates a real flag from ordinary chop. The flagpole is a steep, near-vertical rally on strong volume, the powerful move that the pattern goes on to continue. The flag is the brief consolidation that follows, drifting slightly down or sideways between two roughly parallel trend lines. It looks like a small flag hanging off the pole, and volume usually fades through it.
The flag slopes gently against the trend, so a bullish flag tilts slightly down. That counter-trend drift is a healthy sign. It shows the market pausing to catch its breath inside an uptrend instead of reversing. A consolidation that slopes steeply down, or that lasts too long, is a warning that the move may be failing rather than resting.
What does the bullish flag signal?
The pattern reflects a temporary balance after a burst of buying. The flagpole is a wave of aggressive demand. During the flag, early buyers take some profit and new buyers wait for a better price, which lets price ease back gently, and sellers still cannot force a real decline. When the waiting buyers step back in, price breaks above the flag and the uptrend continues, often with force as sidelined demand returns at once.
Because it develops in the direction of an existing move, the bullish flag tends to be a higher-probability setup than many reversal chart patterns. You are trading with an already-strong trend rather than betting against it. The context, an established uptrend with a clean flagpole, is what gives the setup its edge.
How do you trade a bullish flag pattern?
Flag pattern trading follows a clear sequence that fixes your entry, your risk, and your target in advance.
- Identify the flagpole first, looking for a strong, high-volume rally, because without a clear pole there is no flag, only a range.
- Draw the flag by marking the two parallel trend lines around the gentle downward consolidation that follows.
- Enter on the breakout, buying when price closes above the upper trend line of the flag as volume picks up, and treat a retest of the broken line as a second, lower-risk entry.
- Set a protective stop below the lower trend line of the flag, or below the flag’s low, since a close back inside or below the flag invalidates the setup.
- Project the target by measuring the height of the flagpole and adding that same distance above the breakout point, which gives the standard measured move.
The volume signature is a key filter. A textbook bullish flag shows heavy volume on the pole, quiet volume through the flag, and a fresh surge on the breakout. A breakout on weak volume is more likely to fail and fall back into the flag.
Bullish flag vs bearish flag: what is the difference?
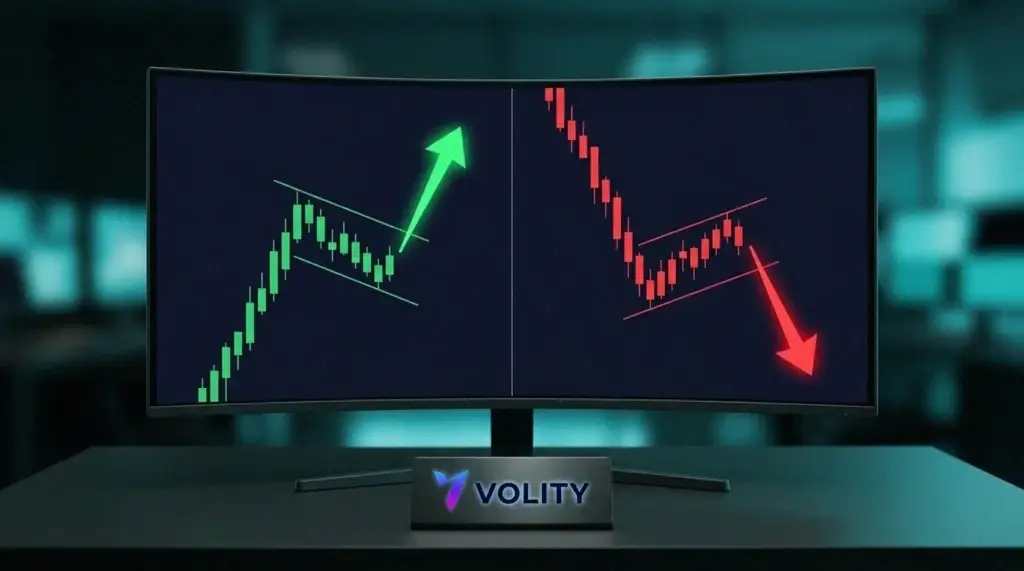
The bearish flag pattern is the exact mirror of the bullish flag. Same structure, opposite direction. It appears in a downtrend and continues it.
| Feature | Bullish flag | Bearish flag pattern |
| Trend | Uptrend | Downtrend |
| Flagpole | Sharp rally | Sharp drop |
| Flag slopes | Slightly down | Slightly up |
| Breakout direction | Above the flag | Below the flag |
| Signal | Uptrend continues | Downtrend continues |
The key detail is that the flag always leans against its trend. A bullish flag drifts down, and a bearish flag drifts up. That counter-trend tilt is what tells a genuine flag apart from a reversal forming. Both trade the same way, so you wait for the breakout in the direction of the flagpole and then target a measured move.
What is a bearish pennant pattern?
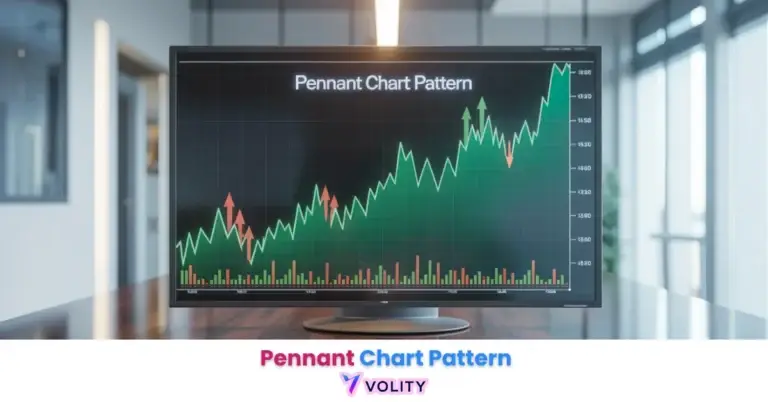
Flags and pennants are close cousins. Both are short continuation patterns that hang off a flagpole, and both trade the same way. The difference is the shape of the consolidation. A flag is a small parallel channel, a rectangle that slopes against the trend, while a pennant chart pattern is a small symmetrical triangle whose trend lines converge to a point.
So a bearish pennant pattern is a small converging triangle that forms after a sharp drop and resolves with a continued move lower, just as a bullish pennant follows a sharp rally and continues higher. Learn to trade one flag or pennant and the rest follow the same logic, which is also why the same breakout steps cover how to trade pennants. Identify the flagpole, wait for the breakout in the trend direction, and project the pole as your target. The consolidation shape changes, and the logic stays the same.
What are the limitations of the bullish flag?
The most common mistake is calling a flag too early, before a genuine flagpole exists, which turns ordinary sideways drift into an imagined setup. False breakouts are the other hazard, where price pushes above the flag, fails to hold, and drops back inside. Flags that consolidate for too long or slope too steeply against the trend are more likely to fail, because the underlying momentum has already faded.
Wait for a clean flagpole, a tidy flag, and a volume-backed breakout, and use the retest when it appears. On leveraged products such as CFDs, a failed breakout can move against you quickly, so a stop below the flag and a fixed risk per trade are essential. The pattern gives you a defined entry and target, and your risk plan keeps a false break small.
How can you trade bullish flag setups on Volity?
Volity is an all-in-one money hub, with your wallet, payments, and trading in one account. There is no minimum to open, you can invest from $1, and live trading starts from , with funding from 10 EUR, with a free demo to rehearse the setup first. The charting in Volity MT lets you mark the flagpole, draw the flag, project a measured-move target, and watch for the breakout across more than 40 forex pairs, global indices, commodities, and crypto. Attach a stop-loss and take-profit at entry so the whole trade is planned before the flag breaks.
Flags work in both directions, which suits CFD trading, where you can trade the bullish flag long and the bearish flag short. This is chart-reading built on the wider discipline of technical analysis. Leverage on selected instruments reaches up to 1:500 (product-dependent), with the margin shown before every order and negative balance protection in place. Currency markets suit the method because they are among the deepest and most liquid anywhere. Execution is regulated by CySEC under UBK Markets, licence 186/12, and bodies such as the FCA and ESMA set the rules on how leveraged products reach retail traders. See the published charges and fees for the full cost picture.
Related patterns
Frequently asked questions
Is a bullish flag pattern reliable?
The bullish flag is one of the more reliable continuation patterns because it trades in the direction of an existing strong trend. Reliability improves with a clean, high-volume flagpole and a tidy flag that slopes gently down, followed by a breakout backed by fresh volume. Like any pattern it still fails at times, so a confirmed breakout and a defined stop remain essential.
Where do you set the target on a bullish flag?
Measure the height of the flagpole, the sharp rally before the flag, and project that same distance upward from the breakout point. That measured move is the standard first target. Many traders take partial profit there and trail the remainder, since a strong trend can extend well beyond the initial projection.
What is the difference between a flag and a pennant?
Both are short continuation patterns that follow a flagpole and trade the same way. The difference is shape. A flag is a small parallel channel that slopes against the trend, while a pennant is a small symmetrical triangle with converging trend lines. A bearish pennant pattern, for example, is a converging triangle after a sharp drop that continues lower.
How long should a bullish flag last?
A flag is a brief pause, typically lasting a handful of bars up to a few weeks depending on the timeframe. The best flags are short and orderly. A consolidation that drags on for a long time, or that slopes steeply against the trend, loses its character as a flag and is more likely to resolve as a reversal or a range instead.