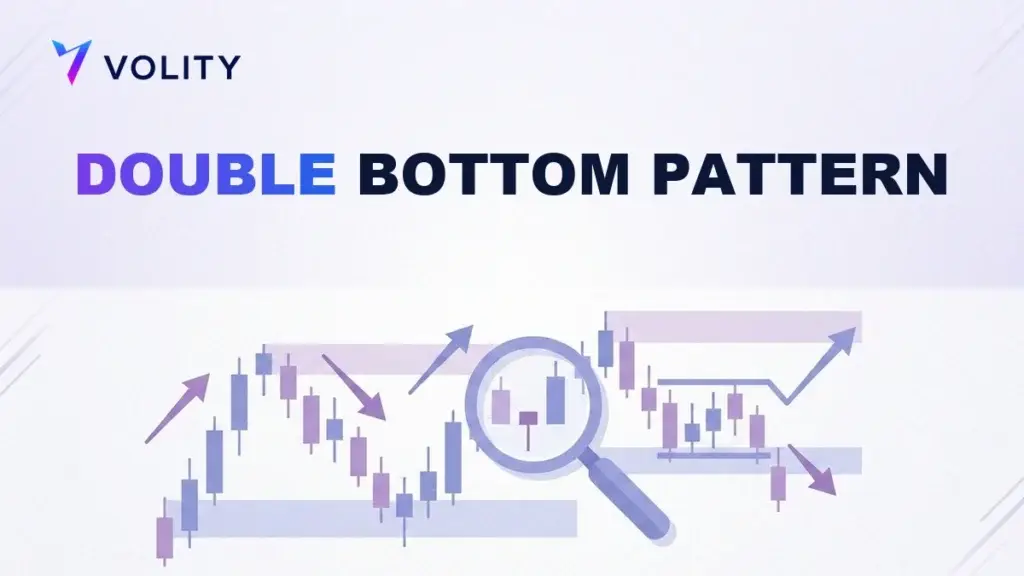
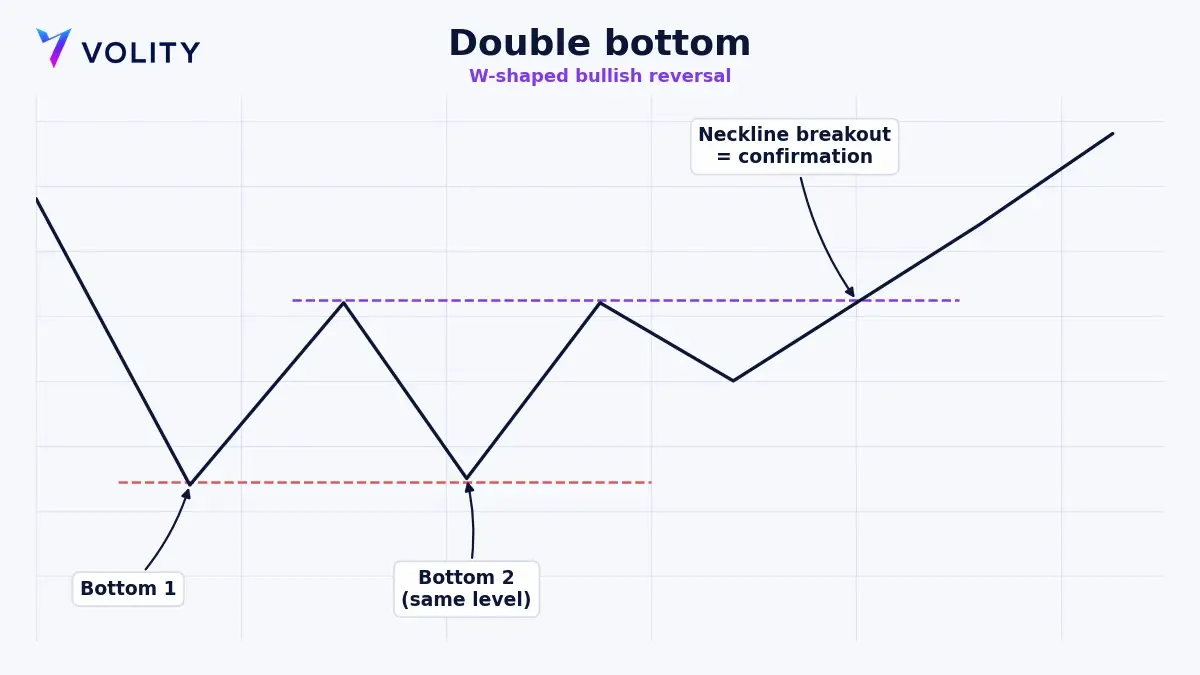
The double bottom pattern is a bullish reversal that forms after a downtrend. Price falls to a low, bounces, falls again to roughly the same low, then rallies. The shape traces a clear W on the chart, and it only confirms when price breaks above the peak between the two lows, a level called the neckline.
What is a double bottom pattern?
A double bottom is a reversal chart pattern with three key parts: two distinct lows at roughly the same price, and one interim peak between them. Traders often call it W pattern trading, because the two troughs and the middle rally draw the letter W. The line across the interim peak is the neckline, and it is the level that decides whether the pattern completes.
For a valid double bottom chart pattern, the two lows should sit within a few percent of each other, with a meaningful bounce between them rather than a shallow wobble. A downtrend must come first, because without a prior decline there is nothing to reverse. The wider apart in time the two bottoms are, within reason, the more significant the eventual signal tends to be.
What does a double bottom signal?
The pattern tells a story about failed selling. Price reaches a low and sellers pause, letting buyers lift it into the interim peak. Sellers then drive it back down to test the low a second time, but this time they cannot force a new low. That second failure is the message: demand is defending this level as support, and supply has run out of force. When buyers then push price through the neckline, the balance has clearly shifted to the upside.
Until the neckline breaks, the pattern is only potential. Two lows at a similar level can just as easily be the start of a sideways range. The breakout is what turns a shape into a signal, which is why disciplined traders wait for it instead of buying the second low and guessing the turn.
How do you trade a double bottom pattern?
A clean process defines your entry, your risk, and your target before you commit. Draw the neckline as a horizontal trend line across the interim peak, then work through the steps below.
- Confirm the structure by checking for a prior downtrend, two lows at a similar level, and a clear neckline across the interim peak.
- Wait for the breakout and enter when price closes above the neckline, since a close rather than a brief spike filters out many false breaks.
- Use the retest if it is offered. Price often returns to the neckline after breaking out, and a successful retest, where the old neckline holds as support, gives a lower-risk entry.
- Set a protective stop below the second bottom, or below the neckline on a retest entry, because a move back under the lows invalidates the pattern.
- Project the target by measuring the height from the lows to the neckline, then adding that same distance above the breakout point. This measured move is the standard first target.
Volume adds confidence. A breakout on higher-than-average volume suggests genuine buying behind the move, while a break on thin volume is more prone to failing and dragging price back into the range.

Double bottom vs double top: what is the difference?
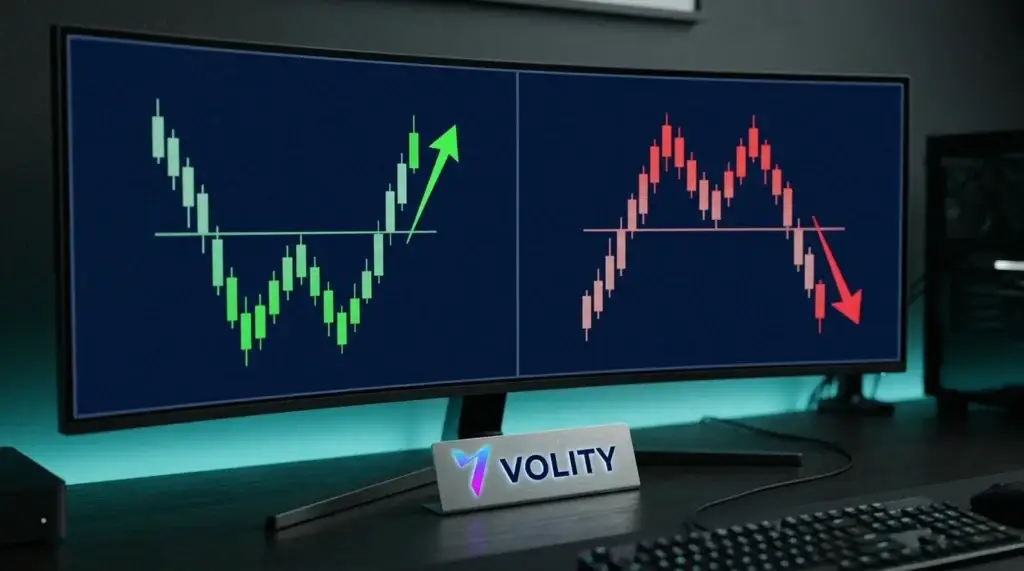
The double top pattern is the exact bearish mirror of the double bottom. Same logic, opposite direction. Learn one and the other follows, which is why they are often taught together as double top and double bottom patterns.
| Feature | Double bottom | Double top pattern |
| Shape | W | M |
| Forms after | A downtrend | An uptrend |
| Two equal | Lows | Highs |
| Neckline break | Upward (bullish) | Downward (bearish) |
| Signal | Bullish reversal | Bearish reversal |
In a double top, price makes two highs at a similar level, fails to break higher the second time, and confirms a bearish reversal when it breaks below the neckline. The measured move works the same way, projected downward from the break. The head and shoulders pattern is another well-known reversal built on the same idea of a failed high and a neckline break.
What is a triple bottom?
A triple bottom pattern is a close relative of the double bottom, with three lows at roughly the same level instead of two. The extra test of support makes the level even more significant, because sellers have now failed three times. It confirms the same way, on a break above the resistance formed by the peaks between the lows, and it is traded with the same breakout, stop, and measured-move logic.
Triple bottoms are rarer than double bottoms and take longer to form. When one does complete, the repeated defence of the level can make the eventual breakout a powerful move, though the same rules on confirmation and risk still apply.
What are the limitations of the double bottom?
The main trap is acting too early. Two lows at a similar level are not a double bottom until the neckline breaks, and traders who buy the second low in anticipation are often caught when price rolls over into a range or a new leg down. False breakouts are the other hazard, where price pokes above the neckline, fails, and reverses, stopping out early entrants.
Wait for a confirmed close beyond the neckline, favour breakouts backed by volume, and use the retest when it appears. On leveraged products such as CFDs, a false breakout can move against you fast, so a stop below the pattern lows and a fixed risk per trade are essential. This is common ground across reversal patterns: the pattern gives you defined levels, and your risk plan keeps a failed break small.
How can you trade double bottom setups on Volity?
Volity is an all-in-one money hub, with your wallet, payments, and trading in one account. There is no minimum to open, you can invest from $1, and live trading starts from , with funding from 10 EUR, with a free demo to rehearse the setup first. The charting in Volity MT lets you draw the neckline, project a measured-move target, and watch for the breakout across more than 40 forex pairs, global indices, commodities, and crypto. Attach a stop-loss and take-profit at entry so the trade is set before the breakout even completes.
Reversal patterns work in both directions, which suits CFD trading, where you can trade the double bottom long and the double top short. This is chart-reading built on the wider discipline of technical analysis. Leverage reaches up to 1:500 on selected forex pairs, 1:100 on commodities, and 1:50 on crypto, with margin shown before every order and negative balance protection in place. Currency markets suit the method because they are among the deepest and most liquid anywhere. Execution is regulated by CySEC under UBK Markets, licence 186/12, and bodies such as the FCA and ESMA set the rules on how leveraged products reach retail traders. See the published charges and fees for the full cost picture.
Related patterns
Frequently asked questions
Is a double bottom pattern bullish?
Yes. The double bottom pattern is a bullish reversal that forms after a downtrend. It signals that sellers failed to push a new low on the second test, and it confirms when price breaks above the neckline. Its bearish counterpart, forming after an uptrend, is the double top pattern.
What is the W pattern in trading?
The W pattern is another name for the double bottom, because its two lows and central rally trace the letter W on the chart. W pattern trading follows the same rules: wait for the break above the neckline, enter on confirmation, place the stop below the lows, and target a measured move equal to the pattern’s height.
Where do you place the target on a double bottom?
Measure the vertical distance from the two lows up to the neckline, then project that same distance above the breakout point. That measured move is the standard first target. Many traders take partial profit there and trail the remainder, since strong reversals can run well beyond the initial projection.
How reliable is the double bottom chart pattern?
The double bottom chart pattern is one of the more dependable reversal patterns when traded correctly, meaning after a confirmed neckline break rather than on the second low. Reliability improves with a clean structure, similar lows, a volume-backed breakout, and a successful retest. It still fails at times, so confirmation and a defined stop remain essential.