Quick answer
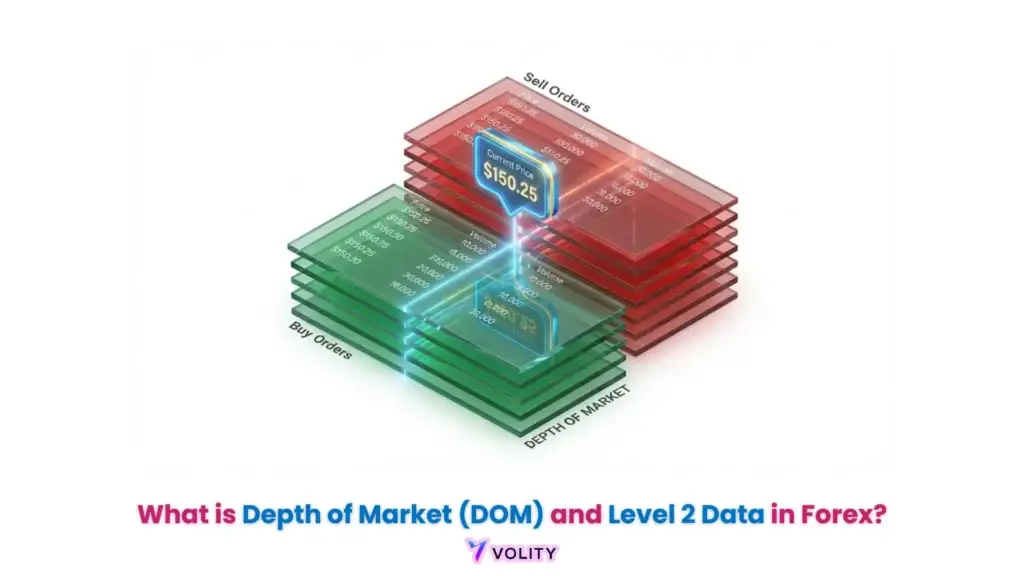
Depth of market (DOM), also called Level 2 data, shows the live buy and sell orders stacked at different prices for an asset, revealing where liquidity sits. Traders use the DOM to gauge supply and demand, spot large orders, and time entries and exits. It is most useful for short-term and order-flow traders on liquid markets.
Trading based on Depth of Market (DOM) and Level 2 data involves high risk and requires sub-millisecond execution speeds. Order book manipulation, such as spoofing, can lead to significant financial loss. Past performance is not indicative of future results. Capital at risk.
While understanding Depth of Market DOM is important, applying that knowledge is where the real growth happens. Create Your Free Forex Trading Account to practice with a free demo account and put your strategy to the test.
Depth of Market (DOM) reveals the underlying supply and demand dynamics of a financial instrument by displaying all pending limit orders. Full-depth feeds were once an institutional-only product; they are now sold to non-professional subscribers by every major exchange, which is why order-flow reading has moved from the trading floor to the retail screen.
Success in high-frequency environments requires moving beyond lagging chart indicators to analyze the live order flow. This guide identifies the technical differences between data levels, the 2026 fee landscape, and the execution strategies required to capitalize on order book imbalances.
Quick takeaways
Here is what matters most for this guide.
- Forex moves nearly $9.6 trillion daily across major, minor, and exotic currency pairs.
- Session timing, leverage, and order types determine whether a setup turns into edge.
- Moreover, central-bank policy and macro data drive the largest intraday moves.
Therefore, read on for the full breakdown below.
What is Depth of Market (DOM) and why does it matter?
Depth of Market (DOM) is a real-time visualization of the limit order book that displays the quantity of buy and sell orders at various price levels. The DOM interface, often called the “price ladder” or “DOM ladder,” reveals the complete market structure beyond the best bid and ask shown on basic charts. Each price level displays the accumulated volume of limit orders resting at that price, allowing traders to identify concentration zones. The DOM shows resting orders before they are consumed, which is what lets an attentive trader recognise absorption patterns or institutional walls while they are still forming rather than after price has moved.
Passive liquidity (resting limit orders) differs fundamentally from aggressive liquidity (market orders executing immediately). DOM visualization enables traders to distinguish these categories and time entries accordingly. price action and market structure explains how DOM aligns with broader technical analysis frameworks.
Ready to Elevate Your Trading?
You have the information. Now, get the platform. Join thousands of successful traders who use Volity for its powerful tools, fast execution, and dedicated support.
Create Your Account in Under 3 MinutesWhat is Level 2 data vs. Level 1 and Level 3?
Level 2 data is an aggregated information feed that displays the full depth of the order book, including multiple price levels beyond the best bid and ask. Level 1 data shows only the best bid and best ask (the “top of book”), the information visible on basic charts. This minimal data point misses the crucial institutional structures resting beneath price. Level 2 data aggregates multiple price levels from various Electronic Communication Networks (ECNs) and market makers, revealing the true shape of supply and demand.
Level 3 data provides the highest transparency tier, offering direct order modification capabilities within the data feed itself, primarily used by registered market makers and institutional participants. A full-depth Level 2 feed carries every displayed price level rather than the single best bid and offer, which is the whole of the difference: Level 1 tells you the price, Level 2 tells you the shape of the book behind it. algorithmic trading and data feeds covers how different data levels integrate into systematic trading strategies.
How much does Level 2 data cost in 2026?
Level 2 data is sold under a tiered fee structure that separates non-professional subscribers from registered professional participants, and the professional rate is a large multiple of the non-professional one on every venue. Fees are set per exchange, per feed and per month, they are revised on the exchange’s own schedule, and the same feed can reach you at a different price through two different brokers. Read the current figure off the exchange’s published price list and your broker’s market-data schedule rather than any secondary summary, because a stale number here is a real cost.
Brokers also differ in how they pass the cost on. Some bundle depth into the platform, some rebate it against commission, and some resell it at the exchange rate, so the headline subscription is only part of what you pay. The structural background to all of this is set out in the Markets Committee report Electronic trading in fixed income markets, which traces how electronification changed who supplies liquidity and how it is displayed.
How do you read a DOM ladder for order flow signals?
Reading a DOM ladder involves identifying clusters of high-volume limit orders, known as “buy walls” or “sell walls,” that act as potential support or resistance. Absorption occurs when aggressive market orders are gradually filled by a large “resting” order without visible price movement, a signal that institutional buyers are accumulating before reversal. Spoofing represents the manipulation inverse: large orders placed with no intent to execute, designed to trigger emotional retail reactions before cancellation just before price reaches them.
Iceberg Orders hide the true size of institutional execution; a trader might see only 100 shares at a level while 10,000 shares remain hidden in the order, executing in small chunks as market orders hit the visible portion. DOM discipline separates genuine supply and demand from manipulative fake orders.
Worked illustration of absorption, not a record of a specific trade: an index future approaches a round level where a large buy order is resting on the DOM. Aggressive sellers keep hitting the bid, yet price does not trade through the level, because the resting order is filling every one of them.
When the selling exhausts itself without the level giving way, the imbalance that remains is the signal. The mechanism is what matters here; the size of any move that follows is not something the book can tell you in advance. Past performance is not indicative of future results.
finding a consistent trading edge explains how to develop systematic edge from DOM-based signals.
Is Level 2 data useful for Crypto and Forex trading?
The utility of Level 2 data for crypto and forex depends on the existence of a centralized order book or the depth of aggregated ECN liquidity. The Markets Committee study of FX execution algorithms and market functioning describes the same fragmentation problem from the institutional side: in a market with no single book, what any one screen shows is one slice of the available liquidity. Crypto exchanges like Binance and Kraken display clear “buy/sell walls” on their DOM interfaces, making Level 2 data highly useful for identifying institutional accumulation and exit liquidity. Forex markets, however, operate in a decentralized interbank structure; DOM often displays only your specific broker’s liquidity rather than the true global order book. This limitation reduces DOM’s predictive power in currency pairs.
Futures markets represent the gold standard for DOM trading because all orders are cleared through a central exchange (CME for US equities and indices). ES (E-mini S&P 500) and NQ (Nasdaq 100) futures contracts display transparent, unified DOM reflecting the entire market structure. derivative trading and order flow explains how futures markets differ structurally from equities and cryptocurrencies.
Level 1, Level 2 and Level 3: what each feed actually shows
The three data levels are defined by how much of the order book they carry, not by how much they cost. Knowing which one you are looking at tells you which questions your screen can answer and which it cannot.
| Feed level | What it shows | What it cannot show | Typical user |
| Level 1 | Best bid, best offer and last trade | Any resting size away from the touch | Chart-based and position traders |
| Level 2 | Every displayed price level on both sides, with aggregate size | Hidden and iceberg size, and the identity behind an order | Order-flow and short-term traders |
| Level 3 | Full book plus the ability to enter and amend orders in the feed | Nothing further at the displayed layer | Registered market makers |
| Time and sales | Executed trades, with size and aggressor side | Intent that never executes | Used alongside Level 2 to confirm the book |
Definitions follow the standard market-microstructure treatment set out in the Wikipedia market depth article. This table is definitional; it carries no fee figures, because published exchange fees change on the exchange’s own schedule and any number quoted here would be stale before you read it.
Turn Knowledge into Profit
You have done the reading, now it is time to act. The best way to learn is by doing. Open a free, no-risk demo account and practice your strategy with virtual funds today.
Open a Free Demo AccountKey Takeaways
- Depth of Market (DOM) provides a real-time view of the limit order book, showing the supply and demand at every price level.
- Level 2 data reveals “hidden” liquidity such as iceberg orders and institutional buy/sell walls that basic charts cannot show.
- Full-depth data is now sold to non-professional subscribers, at a fraction of the professional rate, on every major venue.
- Absorption occurs when a large resting order “soaks up” aggressive market orders, often signaling a high-probability price reversal.
- Order flow tools like DOM are most reliable for centralized markets like Futures and Equities compared to decentralized Forex markets.
- Detecting spoofing requires monitoring order persistence; genuine orders stay on the book longer than manipulative fake orders.
Frequently Asked Questions
This article contains references to Depth of Market (DOM) and Volity, a regulated CFD trading platform. This content is produced for educational purposes only and does not constitute financial advice or a recommendation to buy or sell any financial instrument. Always verify current regulatory status and platform details before using any trading service. Some links in this article may be affiliate links.
What our analysts watch: DOM-based execution rewards traders who read the multi-layer signal rather than the surface book, and three reads sharpen the analysis. Order-book imbalance ratio (total bid size versus total offer size in the top five to ten levels) versus the executed-tape direction, where the imbalance pointing one way while tape prints the other indicates fading liquidity that experienced traders use as a fade signal.
Cancel-replace velocity at specific levels, where rapid cancel-and-reload of large orders typically indicates algorithmic spoofing that retail traders should ignore as a directional signal. Iceberg-order detection through executed-trade tape, where small visible orders absorbing repeated large market orders without depleting indicate hidden institutional liquidity that materially changes the read of the visible book.
Spoofing has been the subject of high-profile enforcement actions by CFTC and major exchanges, which is why the institutional approach treats unsupported large book entries as suspect rather than as signal. Volity desk tracks DOM-based execution under CySEC 186/12 oversight via UBK Markets with entities in Saint Lucia and Cyprus.
Related guides
- Day trading
- Forex scalping strategy
- Best trading platforms
- Chart trading platforms
- Foreign exchange market
Volity operates a trading platform and also publishes educational and analytical content about trading. The content on this page is for educational purposes only and should not be considered financial advice. Volity may benefit commercially when readers open trading accounts through links on this site.
Our content is produced and reviewed under documented editorial standards; see our comparison and review methodology.