Quick answer
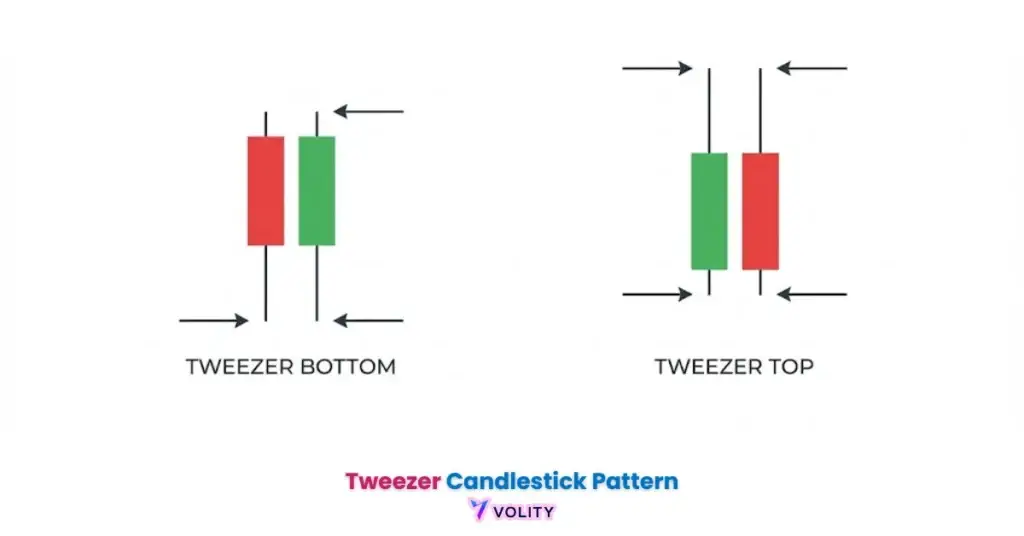
The tweezer is a two-candle reversal pattern where two candles share almost the same high (tweezer top) or low (tweezer bottom), signaling that a trend may turn. A tweezer bottom in a downtrend hints at a reversal up; a tweezer top in an uptrend hints at a reversal down. Like all candlesticks, it needs confirmation before acting.
Tweezer patterns frequently generate false signals during algorithmic liquidity hunts where price pierces the shared wick extreme then reverses before follow-through. Trading without the “Third Candle” confirmation rule makes premature entries high-risk. Crypto tweezers are less reliable again, because 24/7 volatility and exchange liquidation cascades target obvious price levels. Stop-loss placement inside the Tweezer wick exposes traders to market breath that triggers stops before the reversal executes. Past performance is not indicative of future results. Capital at risk.
The Tweezer Candlestick Pattern is a two-candle reversal formation characterized by two adjacent candles sharing an almost identical high (Tweezer Top) or low (Tweezer Bottom). The pattern is far weaker than its reputation. Thomas Bulkowski’s tests of roughly 20,000 examples found the tweezers top acts as a bullish continuation 56% of the time and the tweezers bottom as a bearish continuation 52% of the time, so on its own it points the opposite way to the textbook. That is why the “Third Candle” rule matters: it requires a close beyond the shared wick extreme before the pattern is treated as a signal at all.
The Tweezer candlestick pattern functions as a dual-candle signal of a potential trend reversal. This formation consists of two consecutive bars that share an identical or near-identical high or low, indicating that the market tested a specific price level twice and failed to break it. In the 2026 technical landscape, Tweezers represent the ultimate visual cue for buyer or seller exhaustion.
While traditional analysis relies purely on wick alignment, modern 2026 strategies integrate the “Third Candle” rule and volume spikes to filter out false signals. Understanding the institutional “Liquidity Hunt” dynamics around these levels is essential for avoiding the traps common in high-frequency trading environments.
While understanding Tweezer Candlestick Pattern is important, applying that knowledge is where the real growth happens. Create Your Free Forex Trading Account to practice with a free demo account and put your strategy to the test.
What is a Tweezer pattern and how does it signal a reversal?
A Tweezer pattern is a two-candle reversal formation that identifies a price extreme where market participants have twice rejected a specific high or low level. The dual-test structure shows that institutions have attempted to break through twice, only to fail both times. This repeated rejection signals a fundamental shift in supply or demand balance.
- Tweezer Top (Bearish): Matching highs after an uptrend, signaling buyer exhaustion.
- Tweezer Bottom (Bullish): Matching lows after a downtrend, signaling seller exhaustion.
- The role of “Wick Alignment”: Requiring highs or lows to be within 2-3 pips/ticks of each other.
Repeated rejection at the same price level is a real observation, but it is not a reliable reversal signal. Bulkowski’s tweezers bottom study reports that the tweezers bottom, which theory calls a bullish reversal, actually acted as a bearish continuation 52% of the time, with an overall performance rank of 44 out of 103 candle types. Treat the shared low as a level worth watching, not as a bottom.
Shared wick extremes identify the precise price level where institutional limit orders have absorbed all available market liquidity. When both candles touch the same high or low, it signals that a critical supply or demand zone has been tested and defended. The significance of long wicks versus short bodies reveals the intensity of the rejection, long wicks indicate aggressive buying or selling pressure that was ultimately rejected.
Why the color of the second candle matters for momentum confirmation is critical for validating reversals. A Tweezer Bottom where the second candle is green signals stronger bullish conviction than a red second candle. Similarly, a Tweezer Top with a red second candle indicates stronger bearish pressure than a green one.
Ready to Elevate Your Trading?
You have the information. Now, get the platform. Join thousands of successful traders who use Volity for its powerful tools, fast execution, and dedicated support.
Create Your Account in Under 3 MinutesIdentifying the 2026 Criteria for a “Valid” Tweezer Setup
A valid 2026 Tweezer setup requires the combination of wick precision, high-timeframe context, and momentum confirmation to differentiate from market noise. The three validation criteria separate professional signals from retail false signals. Professional traders layer multiple filters before committing capital.
Wick Precision demands that matching highs or lows must occur at a prior structural level, not randomly in the middle of price action. RSI confluence adds analytical weight, because a divergence between the price extreme and the oscillator means the second test was made on weaker momentum than the first. Volume Spike on the second candle should ideally show higher volume than the first, indicating a decisive rejection. On the Daily (D1) chart the shared low is at least a level that a full session defended, which is more than can be said for an intraday tweezer, but the higher timeframe does not change the pattern’s underlying direction.
Relative Strength Index RSI provides the confirmation layer that validates Tweezer signals. You can also reference technical indicators for trading for broader indicator context around reversals.
Prioritize Tweezer patterns that form with long wicks touching the shared level; in 2026, the length of the wick is directly correlated with the “violence” of the institutional rejection, increasing the signal’s probability of follow-through.
Strategy: The 2026 “Third Candle” Entry Rule
The Third Candle rule identifies the professional requirement of waiting for a subsequent candle to close beyond the Tweezer high or low before executing an entry. This waiting period filters out false breakouts and ensures that the reversal has institutional backing. Premature entries before the third candle closes cost most retail traders their gains.
The 3-Step Playbook guides execution:
Worked illustration of the rule: price falls into a support level on GBP/USD and prints two candles sharing almost the same low. Candle 3 closes above the tweezer high, which is the confirmation. Entry is the open of Candle 4, the stop sits below the shared low, and the first target is the nearest swing high. If Candle 3 fails to close beyond the extreme there is no trade. This is an illustration of the rule, not a record of a specific trade. Past performance is not indicative of future results.
WARNING: Avoid trading “Internal Tweezers” that form inside a tight consolidation range; these shared highs or lows are usually coincidental noise rather than a defended level, which is the one context in which the pattern has any meaning at all.
Performance Comparison: Tweezer Bottoms vs. Tweezer Tops
The two variants are not mirror images. Bulkowski ranks the tweezers top 35th of 103 candle types for frequency but 81st for overall performance, and the tweezers bottom 39th for frequency and 44th for performance. In both cases the tested breakout direction is a continuation of the trend that ran into the level, not a reversal of it.
| Pattern Type | Asset Class | Bulkowski tested behaviour | Best Confirmation | What to watch |
| Tweezer Bottom | Forex (Majors) | Bearish continuation 52% | Oversold RSI | Close beyond the shared low |
| Tweezer Bottom | Blue-Chip Stocks | Bearish continuation 52% | 200-Day EMA | Close beyond the shared low |
| Tweezer Top | Forex (Majors) | Bullish continuation 56% | Overbought RSI | Close beyond the shared high |
| Tweezer Top | Tech Stocks | Bullish continuation 56% | High-Volume Spike | Close beyond the shared high |
| Tweezer Bottom | Crypto (BTC) | Not separately tested | D1 Structure Shift | Close beyond the shared low |
Tested behaviour and rankings from Thomas Bulkowski: tweezers top and tweezers bottom. Bulkowski does not publish separate crypto results.
💡 KEY INSIGHT: In the 2026 Forex market, Tweezer Bottoms at major psychological levels (e.g., 1.0500 or 1.1000) serve as high-conviction institutional footprints where large limit orders exhaust the prevailing selling pressure.
Common Mistakes: Avoiding the “Liquidity Hunt” Trap
Liquidity hunts represent the primary failure mode for Tweezer patterns where algorithmic traders intentionally push price slightly beyond the shared high or low. The “Fake Tweezer” occurs when perfectly identical highs in crypto are often traps set by market makers who profit from retail stop-losses. Contextual Filtering requires recognizing that Tweezers in the middle of a range have zero predictive value, only those at established structural levels matter.
Stop-Loss Management ensures that stops are placed 2-3 pips beyond the wicks to survive “market breath”, the random volatility spikes that trigger stops before reversals execute. Risk Management in Trading addresses how to calculate ATR-based stops that account for current market conditions.
Turn Knowledge into Profit
You have done the reading, now it is time to act. The best way to learn is by doing. Open a free, no-risk demo account and practice your strategy with virtual funds today.
Open a Free Demo AccountDifference Between Tweezers and Double Bottoms/Tops
Timeframe duration identifies the structural difference between the two-candle Tweezer pattern and the multi-bar Double Bottom chart formation. Tweezer: Immediate rejection over 2 sessions, showing that a level is instantly rejected by the market. Double Bottom: Long-term retest over 10-50+ sessions, where price descends gradually and tests the same level twice. Using Tweezers as the “trigger” for a larger Double Bottom formation combines short-term and long-term confirmation signals.
A Tweezer that forms at the same level as a Double Bottom’s first touch creates a powerful confluence signal. Forex Technical Analysis and Japanese Candlestick Patterns both cover the broader context of how these patterns interact across multiple timeframes.
Key Takeaways
- Tweezer candlestick patterns are precise two-candle reversal signals defined by matching highs (Top) or matching lows (Bottom).
- Bulkowski’s tests put the tweezers bottom as a bearish continuation 52% of the time, so a shared low is a level to watch rather than a reversal to buy.
- The Third Candle rule is mandatory for professional execution, requiring a price close beyond the Tweezer extreme to confirm the reversal.
- RSI divergence adds weight to a Tweezer signal, because it shows the second test of the level was made on weaker momentum than the first.
- Wick precision within 2-3 pips is the benchmark for validity; loosely aligned near-tweezers often resolve as temporary noise rather than reversals.
- Liquidity hunts frequently target obvious Tweezer levels, necessitating the use of ATR-based stop-losses that sit outside of algorithmic noise ranges.
Frequently Asked Questions
This article contains references to Tweezer Candlestick Pattern, Tweezer Top, Tweezer Bottom, and Volity, a regulated CFD trading platform. This content is produced for educational purposes only and does not constitute financial advice or a recommendation to buy or sell any financial instrument. Always verify current regulatory status and platform details before using any trading service. Some links in this article may be affiliate links.