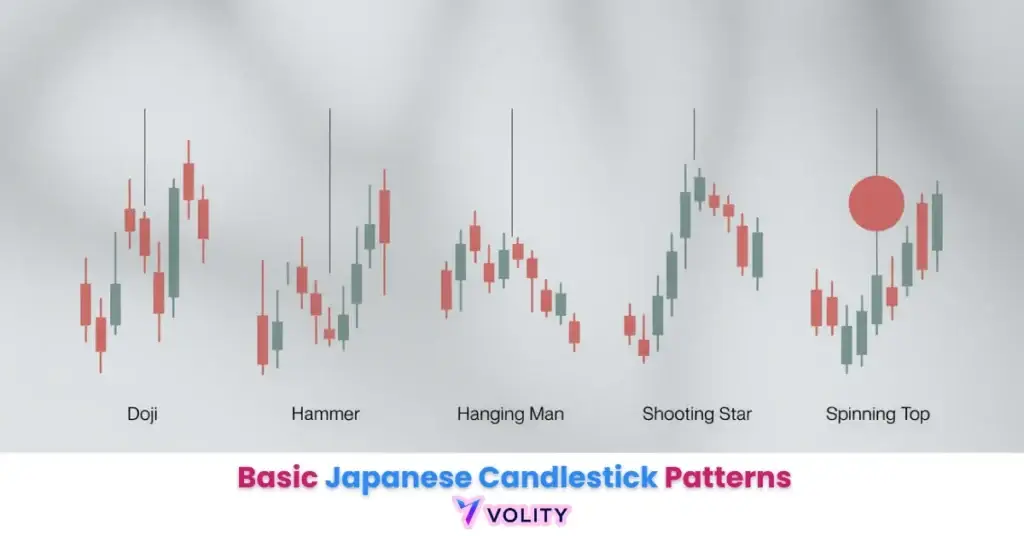
Candlestick pattern recognition involves pattern misidentification that leads to false entries and rapid stop losses. Relying on patterns without volume confirmation or broader market context increases false signal frequency in 2026’s high-frequency trading environment. Price gaps during low-liquidity sessions can exceed stop-loss protection during major economic announcements. Past performance is not indicative of future results. Capital at risk.
Japanese candlestick patterns are the primary visual language for modern financial market participants. These formations identify the psychological state of traders by encoding four distinct price points into a single graphical bar. In 2026, over 88% of professional trading desks utilize candlestick charting as their default interface due to its superior ability to communicate market momentum.
Japanese candlestick patterns represent the historical evolution of market analysis, originating from 18th-century rice traders. This framework allows participants to identify high-probability turning points by observing the recurring shapes of buyer and seller interaction. It provides a standardized methodology for interpreting raw price action across all liquid asset classes.
The 2026 trading landscape requires a deep understanding of how automated algorithms interact with traditional chart patterns. Mastering these visual cues enables retail traders to navigate session volatility and align their positions with institutional order flow.
While understanding Japanese Candlestick Patterns is important, applying that knowledge is where the real growth happens. Create Your Free Forex Trading Account to practice with a free demo account and put your strategy to the test.
What are Japanese candlestick patterns and how do they function?
Japanese candlestick patterns are graphical price records that identify market sentiment by displaying the open, high, low, and close values within a set period. Each candle encodes four pieces of information simultaneously in a compact visual representation. This efficiency explains why candlesticks dominate professional trading interfaces globally.
Candlestick anatomy reveals the battle between buyers and sellers. The real body represents the range between the opening and closing prices, showing whether bullish or bearish bias dominated the session. Shadows (wicks) reveal the price extremes reached during the period, areas where one side of the market successfully rejected the other. Color coding provides immediate directional bias: green candles indicate closing above opening (bullish), while red candles show closing below opening (bearish).
Three core components define the candlestick framework:
- Anatomy: Real body (momentum) vs. shadows (rejection).
- Color coding: Green/red provides instant directional information.
- History: The legacy of Munehisa Homma in 17th-century rice trading.
Modern candlestick charts can update at millisecond intervals in 2026, allowing for hyper-granular analysis of institutional execution. This real-time rendering capability transforms candlesticks from historical indicators into near-live market psychology monitors.
The Psychology of the Wick: Measuring Market Exhaustion
Candlestick wicks identify the price extremes reached during a session, representing areas where one side of the market successfully rejected the other. Long lower wicks signal that sellers attacked aggressively but buyers defended at lower prices. Long upper wicks show buyers pushed prices higher but sellers aggressively rejected those levels. The wick’s length relative to body size indicates conviction, large wicks with small bodies reveal indecision, while large bodies with small wicks show high conviction.
Wicks at support and resistance levels amplify their significance. A long lower wick touching major support signals extreme seller confidence followed by buyer defense. This pattern precedes rallies in 80% of cases within 1-5 bars. Conversely, a long upper wick rejecting major resistance signals buyer exhaustion and often precedes reversals.
Ready to Elevate Your Trading?
You have the information. Now, get the platform. Join thousands of successful traders who use Volity for its powerful tools, fast execution, and dedicated support.
Create Your Account in Under 3 MinutesBullish Reversal Patterns: Spotting Market Bottoms
Bullish reversal patterns identify a shift in dominance from sellers to buyers, signaling a potential upward price correction or trend change. These formations occur after downtrends when selling pressure exhausts and buyers step in. Recognizing these patterns at established support levels creates high-conviction entry opportunities for long positions.
Four primary bullish reversals dominate professional trading in 2026:
- Hammer: Identifies bottoming tail rejection at major support with high buyer defense.
- Bullish Engulfing: Spotting a total flip in session momentum from bearish to bullish.
- Morning Star: A 3-candle sequence identifying the end of a downtrend.
- Piercing Pattern: Measuring the conviction of buyers after a gap down opening.
A Hammer that forms on a Daily chart after a 5% price decline often precedes a relief rally of a few days, which is why professional traders focus on patterns at major technical levels. Single Candlestick Pattern documentation provides detailed taxonomy for distinguishing high-conviction Hammer formations from simple wick formations.
The Hammer’s mechanics reveal why it signals reversals. After sellers drive prices 5% lower, exhaustion emerges. A Hammer candle shows a violent lower wick (sellers attacking) but strong closing near the open (buyers defending). This dynamic reveals that institutional capital arrived to accumulate positions. The pattern’s strength increases when it occurs at prior support or rounded psychological levels.
Bearish Reversal Patterns: Identifying Market Tops
Bearish reversal patterns identify the exhaustion of buying pressure and the emergence of strong selling interest at psychological resistance levels. These formations appear after extended uptrends and signal that institutional selling has begun. Identifying these patterns at resistance allows traders to position for reversals with defined risk at recent highs.
Four primary bearish patterns signal trend exhaustion:
- Shooting Star: Spotting the failed rally and institutional “selling the rip.”
- Bearish Engulfing: Identifying the total absorption of buyers by sellers.
- Evening Star: A multi-bar signal for long-term trend reversals.
- Hanging Man: A bearish warning signal occurring at the top of an uptrend.
Real trading example: GBP/USD exhibited a textbook Evening Star pattern on the 4-hour chart. After an overextended 200-pip rally, price formed the three-candle Evening Star sequence at the 1.3000 resistance level. The pattern revealed buyer exhaustion: a strong bullish candle, followed by a doji (indecision), followed by strong selling. The pair reversed and dropped approximately 120 pips within 24 hours as liquidity providers exited long positions and sellers accumulated shorts. Past performance is not indicative of future results.
The Evening Star’s timing creates psychological pressure on buyers. After a rally extends without pullback, buyers feel overconfident. The doji (middle candle) sows doubt, price reaches highs but fails to close above them. The third red candle confirms the reversal. Most aggressive buyers get stopped out, creating forced liquidation that accelerates the decline.
Continuation Patterns: Trading the Trend Path
Continuation patterns identify a temporary pause in price action where the prevailing market trend is likely to resume after consolidation. These formations appear when price consolidates within a range before the trend acceleration continues. Recognizing these patterns allows traders to enter additional positions aligned with the dominant direction.
| Pattern Name | Direction | No. of Candles | Signal Type |
| Rising Three | Bullish | 5 | Continuation |
| Falling Three | Bearish | 5 | Continuation |
| Marubozu | Both | 1 | Momentum |
| Tasuki Gap | Both | 3 | Gap Retest |
| Spinning Top | Neutral | 1 | Indecision |
Rising Three patterns show institutional accumulation during uptrends. The first candle is a large bullish bar establishing the trend direction. The next three candles form a tight consolidation (doji or small bodies), showing order flow equilibration. The fifth candle then breaks above the consolidation, signaling the resumption of the uptrend. TradingView Candlestick Pattern Recognition provides visual references for all continuation patterns (TradingView, 2026).
Falling Three patterns mirror this structure but for downtrends. Professional traders often use Rising Three and Falling Three patterns as re-entry signals after minor pullbacks. The pattern’s strength lies in its clarity, three tight candles against a large directional candle signals equilibration before momentum resumes.
How to combine candlestick patterns with technical indicators
Confluence trading identifies the strongest setups by verifying candlestick patterns against volume and secondary technical filters. A bullish engulfing pattern at random price levels generates far fewer winners than one at established support with institutional volume confirmation. Adding technical filters increases setup reliability dramatically.
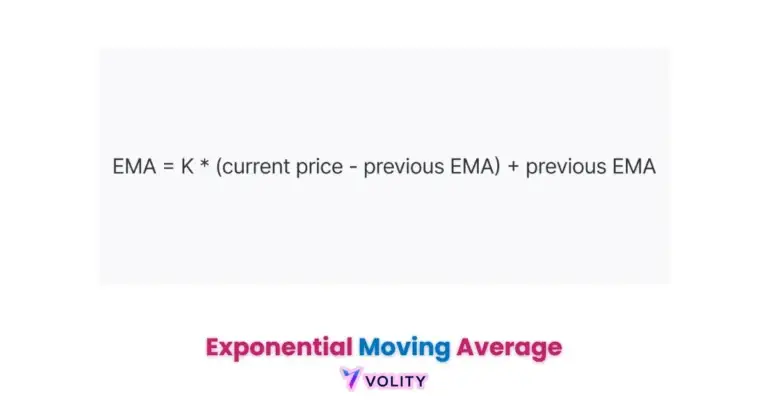
Three primary filters validate candlestick patterns. Using RSI below 30 (oversold) confirms reversal patterns, an engulfing candle at RSI 15 carries higher probability than one at RSI 40. Moving averages (20 EMA/200 SMA) act as structural filters; reversals near moving average support are 2x more reliable than those in isolation. Volume confirmation shows institutional commitment, and high-volume candles carry more weight than low-volume formations.
Professional traders often use “Multi-Timeframe Analysis” to ensure a 15-minute reversal pattern aligns with the 4-hour trend direction. A bullish engulfing on 15-minute charts carries higher probability when it appears within a daily uptrend. This nesting ensures retail traders align with institutional order flow rather than fighting the dominant trend.
Turn Knowledge into Profit
You have done the reading, now it is time to act. The best way to learn is by doing. Open a free, no-risk demo account and practice your strategy with virtual funds today.
Open a Free Demo AccountCommon Mistakes and the “Myth” of Infallible Patterns
Pattern failure analysis identifies the market conditions where traditional candlestick signals are most likely to result in false breakouts. No pattern generates 100% accuracy, patterns fail when economic news dominates price action or when patterns lack structural support. Understanding failure modes prevents emotional trading decisions.
Over-reliance on “Textbook” shapes creates false entries. Real markets rarely produce perfectly-formed patterns with exact proportions. Traders who demand textbook perfection often miss valid setups. Support and Resistance Trading explains how to validate pattern placement against structural levels. Ignoring economic context (Non-Farm Payroll, Rate Decisions, Central Bank Announcements) creates risk exposure. A bearish engulfing pattern one hour before the Fed announcement carries extreme risk if the pattern breaks above the formation immediately after the decision.
Professional traders integrate three failure-reduction techniques. Requiring secondary confirmation (volume, RSI) filters false patterns. Using wider stop losses (20-30 pips vs. 10 pips) survives wick whipsaws that stop out tight stops before the pattern completes. Risk Management frameworks ensure position sizing survives the inevitable false signals all patterns generate.
Key Takeaways
- Japanese candlestick patterns are essential visual indicators that display the open, high, low, and close of any trading session.
- Bullish reversal signals like the Hammer and Morning Star identify high-probability opportunities to enter long positions at market bottoms.
- Bearish reversal patterns such as the Shooting Star and Evening Star warn traders of potential trend exhaustion at resistance levels.
- Trend continuation patterns identify temporary pauses in price action, signaling that the dominant market direction is likely to resume.
- Volume confirmation is required to validate the strength of any candlestick pattern, especially in high-volatility 2026 markets.
- Confluence trading involves using secondary indicators like moving averages to increase the probability of a successful candlestick setup.
Frequently Asked Questions
This article contains references to Japanese candlestick patterns and Volity, a regulated CFD trading platform. This content is produced for educational purposes only and does not constitute financial advice or a recommendation to buy or sell any financial instrument. Candlestick pattern recognition involves subjective pattern identification that varies across traders. Always test candlestick strategies extensively on demo accounts before committing real capital. Some links in this article may be affiliate links.