Mean reversion strategies fail catastrophically when central bank policy pivots fundamentally shift market regimes. Entering mean reversion trades during “falling knife” situations, where new trends are forming, can produce rapid, unrecoverable losses. Standard deviation bands may widen dramatically during volatility spikes, causing stop losses to be hit before reversions complete. Averaging down into losing mean reversion positions exposes traders to compounding losses. Past performance is not indicative of future results. Capital at risk.
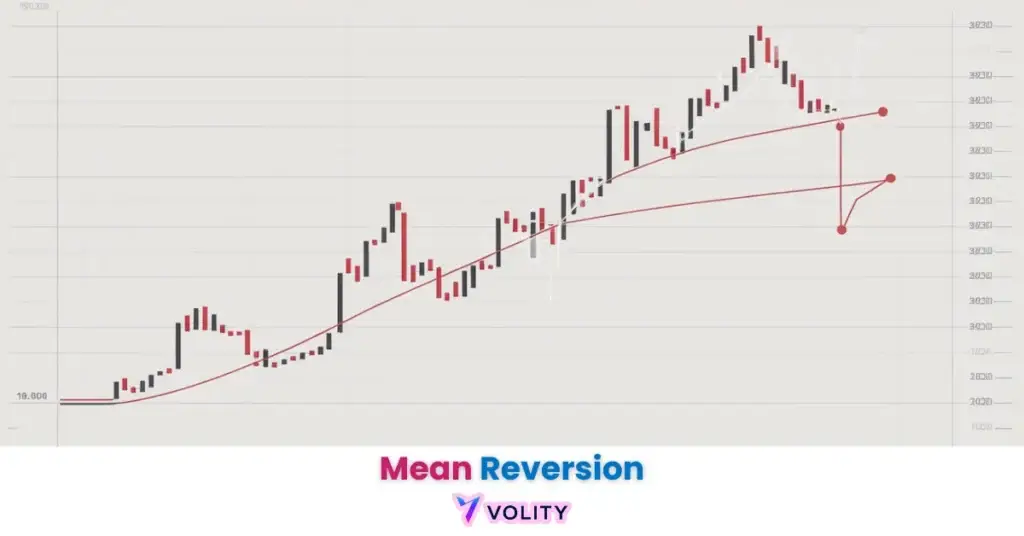
Mean reversion is a financial theory suggesting that asset prices and historical returns eventually gravitate back toward their long-term average after extreme deviations. In 2026, this strategy remains the cornerstone of quantitative and retail trading systems that target overextended price moves in range-bound markets. Mastering regime detection tools like the Hurst exponent is essential for distinguishing between a temporary pullback and a structural trend shift.
Mean reversion trading operates on the assumption that market extremes are temporary and price will eventually seek equilibrium. This approach allows investors to capitalize on the exhaustion of buying or selling pressure. It stands in direct contrast to trend-following strategies, which expect price momentum to persist indefinitely.
The 2026 trading environment emphasizes the importance of regime detection to avoid “catching falling knives” during structural shifts. Successful practitioners utilize a combination of statistical oscillators and volatility bands to pinpoint precise reversal levels in range-bound instruments.
While understanding Mean Reversion is important, applying that knowledge is where the real growth happens. Create Your Free Forex Trading Account to practice with a free demo account and put your strategy to the test.
What is mean reversion in financial markets?
Mean reversion is the tendency of an asset’s price or volatility to gravitate back toward its long-run average after reaching an extreme deviation.
Market prices do not remain at extremes indefinitely. The further price travels from a long-run average in standard-deviation terms, the more stretched the move is relative to its own recent history, which is what overbought actually means. It is a measure of stretch, not a forecast of when the snap-back arrives. The concept of “stationarity” in price series explains this phenomenon. A stationary price series maintains consistent statistical properties, the mean and variance remain constant over time. This constancy means that extreme deviations from the mean carry inherent pressure to revert.
Prices deviate from their averages for several reasons. Overreactions to news events cause temporary spikes or crashes before reality recalibrates. Liquidity imbalances create momentum when few sellers exist at market prices. But these temporary dislocations eventually resolve as equilibrium reasserts itself.
- The concept of “Stationarity” in price series
- Why prices deviate: Overreactions, news shocks, and liquidity imbalances
- The “Rubber Band” analogy: The further price stretches from the mean, the stronger the pull back
The formal statement of the idea is that a series with a stable long-run mean will drift back toward it faster than a random walk would, which is the definition used in the reference entry on mean reversion in finance. Note what that does and does not promise: it is a statement about tendency over many observations, not about the next candle.
Mean reversion and historical averages form the core concept. Price extremes represent opportunities for trades that target the return to equilibrium.
The Hurst Exponent and Regime Detection
The Hurst exponent is a statistical measure used to identify whether a price series is mean-reverting, trending, or random.
The Hurst exponent quantifies market behavior on a scale from 0 to 1. A value below 0.5 indicates a mean-reverting regime where reversions are likely. A value above 0.5 indicates a trending regime where momentum persists. A value near 0.5 indicates random-walk behavior. This distinction becomes critical because mean reversion fails during trending regimes.
Professional quantitative traders monitor the Hurst exponent in real-time. When the value drops below 0.5, they activate mean reversion algorithms. When the value rises above 0.5, they switch to trend-following strategies. This regime detection prevents catastrophic “falling knife” trades that characterize many retail failures.
Ready to Elevate Your Trading?
You have the information. Now, get the platform. Join thousands of successful traders who use Volity for its powerful tools, fast execution, and dedicated support.
Create Your Account in Under 3 MinutesWhich indicators are best for mean reversion in 2026?
Bollinger Bands and the RSI Indicator are the primary indicators used to quantify price deviations from the mean.
Bollinger Bands measure price deviation using standard deviations from a moving average. When price pierces the upper band (two standard deviations above the mean), the instrument enters overbought territory. When price touches the lower band (two standard deviations below), it enters oversold territory. Traders view these extremes as reversal opportunities.
RSI identifies exhaustion in momentum. An RSI reading above 70 signals overbought conditions where buyers have exhausted their buying power. An RSI below 30 signals oversold conditions where sellers have exhausted their selling pressure. These extreme readings precede reversals as momentum naturally decelerates.
Moving averages serve as the actual “mean” that price targets. The 20-period simple moving average identifies the short-term equilibrium. When price deviates significantly above it, reversion traders expect price to return. When price crashes below it, they expect recovery.
- Bollinger Bands: Using standard deviations (2.0 or 2.5) to find overextended zones
- RSI: Identifying overbought (>70) and oversold (<30) conditions
- Moving Averages (SMA/EMA): Serving as the actual “mean” that price targets
A Z-Score indicator states directly how many standard deviations price sits from its own moving average, which is the same measurement a band touch expresses visually. It is the cleanest way to compare stretch across instruments that trade at very different absolute levels.
The relative strength index and Bollinger Bands are the two standard ways of expressing that stretch, one as a bounded oscillator and one as a price envelope. They tend to agree, and it is their disagreement that is informative.
Mean Reversion vs. Trend Following: Key Differences
Mean reversion assumes that market extremes will correct, whereas trend following expects price momentum to continue in the established direction.
Mean reversion thrives in range-bound markets where price oscillates between support and resistance. Trend following thrives in breakout markets where price accelerates in one direction. These two philosophies produce opposite signals in identical price action. When price tests a high, mean reversion traders sell expecting rejection. Trend following traders buy expecting breakout. One profits while the other suffers.
The two styles have opposite risk profiles. Mean reversion tends toward a higher proportion of winning trades with small targets, because it is betting on the common case. Trend following tends toward a lower proportion of winners with a long tail of large ones, because it is betting on the rare case. Specific win rates and pip captures are not quoted here: they depend entirely on the exit rule, the instrument and the period, and no published figure generalises across them.
The “falling knife” risk defines mean reversion failure. A trader enters a short position at the upper Bollinger Band, expecting reversion downward. Instead, a fundamental catalyst (central bank announcement, earnings surprise) triggers a breakout. The reversion thesis becomes invalid as a new trend forms. Stops placed above resistance get hit for massive losses.
- Market conditions: Reversion thrives in ranges; Trend Following thrives in breakouts
- Risk Profile: Reversion has a high win rate with small targets; Trend Following has a lower win rate with large “tail” gains
- The “Falling Knife” risk: Why entering too early in a trend can be fatal for reversion traders
Real trading example: EUR/USD formed a range-bound session on the 1-hour chart with price touching the upper Bollinger Band (2.0) while the RSI sat at 78. Price rejected the band and reverted to the 20-period Moving Average (SMA), yielding a 25-pip profit as the extreme overbought condition corrected. Past performance is not indicative of future results.
Understanding these differences prevents traders from applying the wrong strategy to the wrong market condition.
Why Volatility is the Best Asset for Reversion
Volatility indices show a stronger mean-reverting signature than directional equity or currency price series, because volatility is itself a bounded, clustering quantity rather than a price that can trend without limit. The VIX is the most-watched example.
The VIX (Volatility Index) is the clearest example of a mean-reverting series, because implied volatility is bounded in a way that price is not: it cannot compound upward indefinitely, and panic subsides. Spikes into the 40s and 50s have historically been followed by a return toward the long-run range, but the speed of that return varies enormously and is not something to size a position against. The Cboe historical data for the VIX Index lets you inspect the whole series rather than take that on trust.
Volatility mean reversion works because fear-driven spikes are by nature temporary. Panic creates the spike. Resolution of the catalyst allows fear to dissipate. The VIX reverts to equilibrium naturally. This mechanical process repeats with remarkable consistency across decades of data.
| Asset Type | Reversion Strength | Duration to Mean | 2026 Key Indicator |
| VIX (Volatility) | Very High | Not measured here | VIX Term Structure |
| FX Majors (Ranges) | High | Not measured here | RSI (14-period) |
| Gold (Commodity) | Moderate | Not measured here | Bollinger Bands |
| Growth Stocks | Low | Not measured here | 200-Day SMA |
| Crypto (BTC/ETH) | Very Low | Not measured here | Z-Score Extremes |
Reversion strength above is a qualitative ranking, not a measured one. The earlier version of this table carried an “Duration to Mean” column attributed to a Cboe publication that does not exist; the column has been removed rather than re-sourced. Series-level data for the VIX is published on the Cboe VIX Index dashboard.
Volatility’s mean-reversion properties make it the gold standard for testing reversion strategies. Traders who master volatility reversion often transition to other assets with confidence that underlying principles remain valid.
How to build a successful mean reversion strategy?
A disciplined mean reversion strategy utilizes objective filters to identify extreme price exhaustion before committing capital.
Successful strategies define the “mean” first. A trader selects the 20-period simple moving average as the equilibrium level. This lookback period captures recent price behavior without extending so far back that it becomes irrelevant to current conditions. Next, the trader identifies the deviation threshold. The upper Bollinger Band (two standard deviations) defines overbought. The lower band defines oversold.
Entry confirmation prevents premature entries. A trader does not short immediately when price touches the upper band. Instead, the trader waits for price to reject the band and form a reversal candle that closes below the band. This candle closes confirmation ensures that sellers have actually arrived, not just created a temporary spike.
Risk management prevents catastrophic losses. Stop losses should sit above resistance (not just above the Bollinger Band) to survive temporary wicks. Position sizing should assume that one or two trades will fail due to regime changes.
- Defining the “Mean”: Selecting the appropriate lookback period (e.g., 20 or 50 periods)
- Entry Confirmation: Waiting for a candle reversal pattern or an RSI hook back from extremes
- Risk Management: Using wide stop-losses or structural levels to avoid being stopped out by “noise”
Applying institutional risk-management frameworks ensure position sizing survives inevitable losses. technical indicators for trading explains how to layer multiple oscillators for confirmation.
Turn Knowledge into Profit
You have done the reading, now it is time to act. The best way to learn is by doing. Open a free, no-risk demo account and practice your strategy with virtual funds today.
Open a Free Demo AccountThe Future of Mean Reversion in 2026
Artificial intelligence identifies non-linear mean reversion patterns that traditional linear oscillators often overlook in high-frequency environments.
Policy turning points are the single most common cause of a broken reversion thesis, and they are announced rather than inferred: the ECB Economic Bulletin and its equivalents are where a regime change becomes public. Machine learning models detect mean reversion signals that traditional oscillators miss. AI systems analyze thousands of price patterns and discover subtle regime shifts before they become obvious to human traders. These models generate probabilistic predictions rather than binary buy/sell signals, allowing traders to size positions according to confidence levels.
Comparing mean reversion to Elliott Wave Theory reveals complementary approaches. Elliott Wave traders identify five-wave impulses followed by three-wave corrections. Mean reversion traders can use Elliott Wave structure to identify ideal reversion entry points during the correction phase. The two methodologies combine powerfully.
technical indicators for trading covers how AI-enhanced indicators integrate mean reversion logic. trading-wedge-patterns describes consolidation patterns that often precede mean reversions.
Key Takeaways
- Mean reversion is the statistical tendency for an asset’s price to return to its historical average after an extreme deviation.
- Range-bound markets are the ideal environment for mean reversion strategies, as prices oscillate between established support and resistance.
- RSI and Bollinger Bands serve as the primary technical tools for identifying overbought or oversold extremes in 2026.
- Regime detection using the Hurst exponent is critical for distinguishing between a mean-reverting range and a new trending phase.
- Volatility (VIX) is considered the most reliably mean-reverting asset class due to its inherent cyclical nature.
- Risk management in mean reversion requires strict exit rules to prevent catastrophic losses during strong momentum breakouts.
Frequently Asked Questions
This article contains references to Mean Reversion trading and Volity, a regulated CFD trading platform. This content is produced for educational purposes only and does not constitute financial advice or a recommendation to buy or sell any financial instrument. Mean reversion strategies carry significant risk during regime changes and fundamental market shifts. Always test mean reversion strategies extensively on demo accounts before committing real capital. Some links in this article may be affiliate links.