Trading technical patterns like the Bear Flag involves significant risk, especially in volatile markets. Chart patterns can fail or produce false signals (‘fakeouts’). Always use stop-loss orders to protect your capital. Past performance is not indicative of future results.
The Bear Flag pattern is a staple of price action trading, identifying high-probability continuation setups during bearish market cycles. Traders who track candle signals alongside chart patterns keep our printable candlestick cheat sheet within reach. It consists of a vertical price decline, known as the flagpole, followed by a period of ascending consolidation that forms the flag. According to 2025 technical benchmarks, valid bear flags that reach their full profit target achieve a 72% success rate (VT Markets, 2025), making them essential tools for short-sellers.
While the pattern appears simple, its reliability depends on specific volume profiles and retracement limits. 2026 trading standards emphasize that multi-timeframe alignment provides a 23% boost to setup probability (VT Markets, 2025). By integrating volume analysis and the ‘measured move’ methodology, traders can execute positions with defined risk-to-reward ratios.
While understanding Bear Flag Pattern is important, applying that knowledge is where the real growth happens. Create Your Free Forex Trading Account to practice with a free demo account and put your strategy to the test.
Quick takeaways
Here is what matters most for this guide.
- Forex moves nearly $9.6 trillion daily across major, minor, and exotic currency pairs.
- Session timing, leverage, and order types determine whether a setup turns into edge.
- Moreover, central-bank policy and macro data drive the largest intraday moves.
Therefore, read on for the full breakdown below.
What is a Bear Flag pattern and how does it signal bearish continuation?
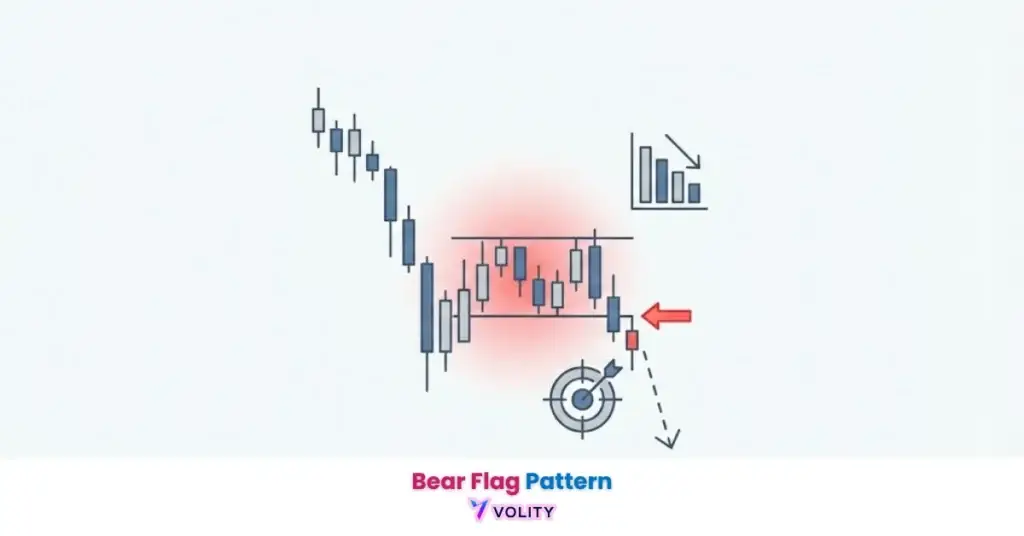
The Bear Flag is a bearish continuation pattern that signals a temporary consolidation before a market resumes its downward trajectory. The flagpole emerges from a sharp, nearly vertical decline where sellers dominate the market, establishing momentum and directional conviction. The flag phase represents a temporary pause where buyers execute a “weak hands” bounce, attempting to reverse the trend but lacking sufficient volume to sustain upward movement. This upward consolidation typically forms a channel or triangle shape, containing price within upper and lower bounds before the eventual breakdown resumes the downtrend.
Market psychology during the flag phase reveals why the pattern proves so reliable. Sellers who missed the initial drop position themselves to re-enter the market at improved prices, while weak buyers who caught the early decline begin taking profits. The resulting equilibrium creates the visual flag formation. a temporary respite in an otherwise bearish market structure. reading candlestick charts explains the candlestick mechanics that form the flagpole’s characteristic sharp decline and the flag’s consolidation bars.
Ready to Elevate Your Trading?
You have the information. Now, get the platform. Join thousands of successful traders who use Volity for its powerful tools, fast execution, and dedicated support.
Create Your Account in Under 3 MinutesHow do you calculate the Bear Flag measured move profit target?
Traders execute the ‘measured move’ methodology to calculate Bear Flag profit targets by projecting the length of the initial flagpole downward from the breakout point. The calculation process begins by measuring the vertical distance from the flagpole’s peak to its bottom. this distance becomes the template for downside projection. Once price breaks below the flag’s lower support line, traders measure that identical distance downward from the breakout price, establishing the profit target. This methodology achieves success in 72% of valid setups (VT Markets, 2025), providing clear risk-to-reward frameworks for position sizing.
Volatility adjustments account for market conditions that 2026 quants address by widening targets by 5% in volatile altcoin markets. Bitcoin bear flags typically require tighter adjustment because their flagpole movements are more defined, while smaller-cap cryptocurrency patterns exhibit wider breakout ranges. types of breakouts details the mechanics of break confirmation and shows how volume divergence signals validate initial downside momentum.
What is the success rate of Bear Flag patterns in 2025?
Bear Flag reliability demonstrates significant variance across asset classes, with Bitcoin setups achieving an 84% win rate during the 2025 market cycle. The baseline for traditional forex and equity bear flags ranges from 67% to 82% (VT Markets, 2025), representing strong performance across multiple markets. Bitcoin’s outperformance emerges from the cryptocurrency’s consistent volume profiles during flush-down movements. sellers execute massive selling pressure at support levels, creating perfect flagpole conditions. Multi-timeframe alignment increases probability by an estimated 23%, meaning traders who confirm the daily flag breakout is aligned with weekly-timeframe bearish structure execute higher-confidence setups.
| Pattern Type | Success Metric | Value |
| Bear Flag | Success Rate | 67% – 82% (VT Markets, 2025) |
| Bitcoin Bear Flag | 2025 Win Rate | 84% (Atomic Wallet, 2025) |
| Bear Flag | Measured Move Achievement | 72% (VT Markets, 2025) |
| Multi-Timeframe | Success Probability Boost | 23% (VT Markets, 2025) |
| Flag Consolidation | Max Retracement Level | 50% of Flagpole (VT Markets, 2025) |
Sources: Data compiled from VT Markets benchmarks and Atomic Wallet technical analysis studies.
VT Markets: Bear Flag Technical Analysis Benchmarks verifies the success rates and measured move achievement across global equity and cryptocurrency markets.
Why is the 50% retracement rule critical for pattern reliability?
The 50% retracement rule identifies pattern strength by determining whether the upward consolidation remains a secondary correction or signals a trend reversal. This threshold separates high-probability setups from pattern failures. once the consolidation retraces more than 50% of the original flagpole’s decline, buyers have regained sufficient momentum to invalidate the bearish structure. Optimal, high-probability setups retrace substantially less than this threshold, typically recovering only 25-38% of the initial decline before the breakout occurs. Flags that exceed 50% retracement signal weakening bearish momentum and introduce significant risk of failed breakouts.
Failure signals emerge clearly when price breaks through the 50% threshold. These extended retracements indicate that sellers lack conviction to re-establish downward momentum, creating traps where apparent “bear flags” transform into new uptrends. Traders who pre-identify the 50% retracement level in advance use it as a hard rule for pattern disqualification, exiting positions or refusing entries once this level is breached. StockCharts: ChartSchool Bear Flag Pattern Guide verifies the pattern construction mechanics and retracement thresholds across historical market data.
How do you execute a Bear Flag trading strategy with volume confirmation?
Traders deploy volume confirmation strategies to validate Bear Flag breakdowns and minimize the risk of false signals. High-volume flagpoles create legitimate selling pressure, establishing the pattern’s credibility from the onset. when price declines vertically on explosive selling volume, the pattern foundation proves strong.
The consolidation flag requires declining volume as buyers attempt weak recoveries without significant conviction. Once price approaches the flag’s lower support line, volume must increase sharply on the breakdown to confirm sellers are re-entering with authority.
This volume progression. high on the decline, low on consolidation, high on breakdown. distinguishes valid patterns from false formations.
Entry execution manages positions by deploying sell orders at or just below the flag’s lower support line, allowing traders to capture the initial momentum of the breakout. Stop-loss orders are placed above the flag’s upper resistance, typically 10-15% above the break-even point to accommodate minor wicking before the move develops. volume divergence signals explains the divergence patterns that confirm or invalidate breakout momentum across multiple timeframes.
Real trading example: On February 12, 2026, BTC/USD formed a bear flag following a sharp $10,000 decline from $72,500 to $62,500. The consolidation flag bounced 25% higher to $65,625 on declining volume.
Sellers re-entered at the lower flag support ($62,500), breaking below with explosive volume. The measured move target (another $10,000 decline) projected to $52,500.
Bitcoin declined 15% to reach near-target levels within 48 hours. Past performance is not indicative of future results.
Turn Knowledge into Profit
You have done the reading, now it is time to act. The best way to learn is by doing. Open a free, no-risk demo account and practice your strategy with virtual funds today.
Open a Free Demo AccountWhat are the primary risks of ‘wicking’ and pattern failure?
Bear Flag patterns are susceptible to ‘wicking’ noise and institutional ‘fakeouts’ that can trigger stop-losses before the actual move occurs. Wicking noise emerges when price temporarily exceeds the flag’s upper resistance on intraday volatility spikes. these brief penetrations above the consolidation channel create whipsaw conditions for traders with tight stops. Institutional traders intentionally create wicking to liquidate retail stop-loss orders positioned above the flag, only to resume downward momentum after those positions are flushed. The 2026 quant approach adjusts targets to account for high-volatility stalls where price stalls at the measured move level before penetrating toward secondary targets.
Risk management using ATR-based stop-losses helps traders survive wicking by placing stops wider than typical intraday noise. An ATR multiplier approach uses 1.5x to 2.0x the current ATR value to position stops above the flag, accounting for normal volatility without being caught by minor wicks. Pattern failure also occurs from news-driven reversals where macro events create sustained buying pressure despite the technical bear flag setup. these black swan events invalidate patterns regardless of structure quality. Forex risk management strategies covers the position sizing and stop-placement frameworks that protect capital during whipsaw environments.
Atomic Wallet: 2025 Technical Chart Reliability Study verifies the wicking risks and failure rate patterns across historical cryptocurrency data.
Key Takeaways
- Bear Flag patterns signal bearish continuation with a 2025 verified success rate of up to 82% in optimal conditions.
- Bear Flag ‘measured move’ targets are achieved in 72% of valid setups, providing clear risk-to-reward frameworks.
- Bear Flag reliability depends on the 50% retracement rule, where deeper bounces signal pattern invalidation.
- Bear Flag setups in Bitcoin achieved an 84% win rate during 2025 when supported by high-volume flagpoles.
- Bear Flag volume profiles require high participation during the drop and low interest during the upward consolidation.
- Bear Flag entries should be protected by stop-loss orders placed above the flag’s resistance to mitigate ‘wicking’ risks.
Frequently Asked Questions
This article contains references to technical chart patterns and Volity, a regulated CFD trading platform. This content is produced for educational purposes only and does not constitute financial advice or a recommendation to buy or sell any financial instrument. Always verify current market conditions and platform details before trading. Some links in this article may be affiliate links.
[/coi_disclosure]
What our analysts watch: Three things drive most major-pair moves. Central-bank rate-differential expectations set the longer-term trend.
Liquidity windows during the London-New York overlap concentrate volatility into a few hours. Risk-on or risk-off flows (gauged through equities, bonds, and gold) tilt the dollar against pro-cyclical currencies.
When the rate-differential trend, the session liquidity, and the broader risk regime align, that is typically a high-conviction setup.
Related guides
What Alexander Bennett watches: Bear flags fail when traders force the pattern in the absence of a true impulse leg. The Volity desk grades each setup on three axes: impulse quality (was the flagpole driven by news or breakout volume), consolidation quality (is the retrace orderly and below average volume), and confirmation quality (does the breakdown close beyond the channel with momentum). When all three are present, the measured-move target carries statistical weight. When only one or two align, the setup is opportunistic, not high-conviction.
Volity desk Q&A
What does a bear flag pattern look like on a chart?
A bear flag has two visual components: a steep downward flagpole that establishes the dominant trend, followed by a tighter upward-sloping consolidation channel that retraces a portion of the flagpole. The consolidation typically lasts five to fifteen bars on the timeframe being analysed. Volume usually contracts during the flag and expands on the breakdown. The StockCharts ChartSchool flag pattern reference covers the canonical structure.
How do I trade a bear flag with proper risk management?
The disciplined entry is a short on the close beyond the lower channel, with stop-loss placed above the channel’s upper boundary. Position size derives from the stop distance, not from target enthusiasm. The conventional measured-move target equals the length of the flagpole projected from the breakdown point, but partial profit-taking at intermediate support levels usually outperforms holding for the full target on retail time horizons.
What is the difference between a bear flag and a bear pennant?
Both patterns share the same impulse-then-consolidation-then-continuation structure, but the consolidation differs. A bear flag has parallel trendlines containing the consolidation; a bear pennant has converging trendlines forming a small symmetrical triangle.
Flags typically last longer than pennants. The trading approach is similar, but pennants frequently break down with less follow-through volume because the compression has already discharged some of the directional energy.
The Corporate Finance Institute pennant explainer compares both.
How reliable is the bear flag breakdown signal?
Reliability is context-dependent. Bear flags within a confirmed multi-week downtrend, on instruments with good volume profile and at higher timeframes, tend to deliver follow-through more often than flags on choppy intraday charts. Flag failures are usually identified by a close back above the channel upper boundary, which often signals a complete reversal of the prior impulse. Treat any failed flag as an immediate stop-out trigger; the pattern’s edge depends on respecting the invalidation level.
External references
- StockCharts ChartSchool flag pattern
- Corporate Finance Institute pennant pattern
- CMT Association technical analysis
Volity operates a trading platform and also publishes educational and analytical content about trading. The content on this page is for educational purposes only and should not be considered financial advice. Volity may benefit commercially when readers open trading accounts through links on this site.
Our content is produced and reviewed under documented editorial standards; comparison and review methodology is published here.