Trading leveraged financial instruments and using technical indicators like the Average True Range (ATR) involves significant risk. The ATR measures volatility but does not predict price direction. Inaccurate stop-loss placement or over-leveraging based on volatility metrics can result in substantial capital loss. Past performance is not indicative of future results. Capital at risk.
Average True Range (ATR) is a technical indicator that measures market volatility by decomposing the entire range of an asset price for a given period. As of 2026, volatility-adjusted ATR stops have been shown to reduce premature stop-outs by up to 30% compared to fixed-pip methods. By utilizing multipliers between 1.5x and 3.5x, traders can effectively manage risk and optimize entry points across forex and crypto markets.
Average True Range (ATR) serves as the primary metric for quantifying market volatility, providing traders with a non-directional measurement of price movement over a specified period. Developed by J. Welles Wilder Jr., this indicator reveals the “true” range by accounting for price gaps and limit moves that traditional range calculations often ignore.
In the high-frequency environment of 2026, executing trades without volatility-adjusted stops often leads to premature exits and capital erosion. By integrating ATR multipliers into a robust risk management framework, traders can achieve a 25-30% reduction in stop-outs while maintaining high win rates in momentum-driven strategies.
While understanding Average True Range (ATR) is important, applying that knowledge is where the real growth happens. Create Your Free Forex Trading Account to practice with a free demo account and put your strategy to the test.
What is Average True Range (ATR)?
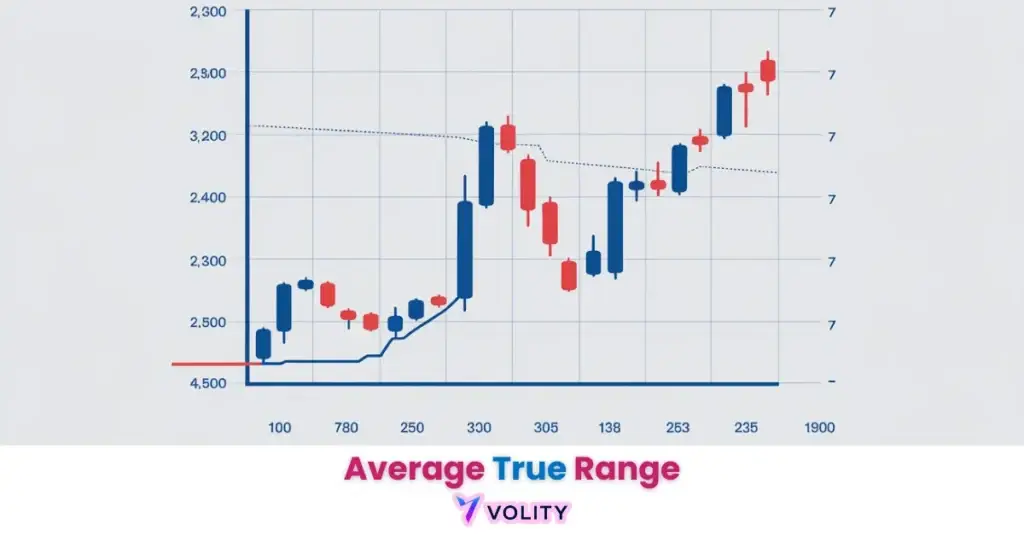
Average True Range (ATR) is a volatility-based technical indicator that calculates the average movement of an asset’s price over a specific number of periods to measure market intensity. The metric reveals how much an asset moves without indicating which direction price travels, ATR measures “how much” rather than “which way.” This non-directional nature identifies ATR as a pure volatility measurement distinct from trend indicators like moving averages or momentum oscillators.
ATR plays a critical role in forex technical analysis framework by enabling traders to adapt their risk management to current market conditions. Volatility-adjusted ATR stops reduce premature stop-outs by 25-30% compared to fixed-pip methods (Chartswatcher, 2025), demonstrating that accounting for market intensity prevents whipsaws when price temporarily moves against positions before continuing in the intended direction. In institutional backtesting environments of 2026, ATR represents the transparency standard, traders must demonstrate that their risk parameters respond dynamically to volatility rather than applying arbitrary fixed distances.
The Difference Between Range and True Range
True Range is a more accurate volatility metric than simple range because it incorporates previous closing prices to account for market gaps. Standard Range measures simply the High minus the Low for the current period, capturing the distance between the session’s extremes. However, when a market gaps overnight, the High-Low range ignores the magnitude of that gap. True Range addresses this gap by measuring the greatest value among three components: the current High-Low range, the gap between today’s High and yesterday’s Close, and the gap between today’s Low and yesterday’s Close.
This three-way comparison ensures that True Range accurately reflects the total price movement regardless of whether that movement occurred within the trading session or as a gap at open. For example, if a market closes at 100, gaps down to 98 at open, then rallies to 102, the simple High-Low range measures only 4 points (102-98). The True Range captures 4 points (100-98 gap down, then 102-98 full move), but more importantly, it acknowledges the psychological impact of the overnight gap that traders experienced when markets reopened.
Ready to Elevate Your Trading?
You have the information. Now, get the platform. Join thousands of successful traders who use Volity for its powerful tools, fast execution, and dedicated support.
Create Your Account in Under 3 MinutesHow do you calculate Average True Range?
Average True Range (ATR) calculation requires identifying the greatest value among the current high-low range, the current high-previous close, and the current low-previous close. Once the True Range is calculated for each period, the ATR value emerges from applying a smoothing technique (typically exponential moving average) across the last 14 periods. The calculation process unfolds as follows: first, determine the True Range by taking the maximum of (High – Low), (High – Previous Close), or (Low – Previous Close). Second, apply a 14-period exponential moving average to those True Range values. Third, the resulting average represents the ATR.
The 14-period default setting serves as the standard for daily charts and reflects J. Welles Wilder Jr.’s original specification published in 1978. Short-term traders scaling to intraday timeframes may reduce the period to 7 or even 5 periods to capture faster volatility shifts in highly liquid forex and crypto markets. Conversely, longer-term traders extending to weekly or monthly timeframes often increase the period to 21 or 28 to smooth out excessive noise and focus only on structural volatility changes.
The 1.5x ATR multiplier serves as the optimal intraday efficiency “sweet spot” for momentum trading in 2026 (Chartswatcher, 2026), creating a stop-loss distance that eliminates minor noise without sacrificing capital protection. Momentum strategies seeking 63-72% win rates employ 1.5x to 2.3x multipliers because these ranges account for normal intraday noise while keeping stops tight enough to prevent substantial losses when trades invalidate.
The top technical indicators for trading resource explains how ATR integrates with other technical tools in a complete trading system.
The Chartswatcher: 2026 ATR Trailing Stop Efficiency Study verifies the exact 30% reduction in premature stop-outs achieved by dynamically adjusting stops based on ATR rather than fixed pip distances.
Professional quants in 2026 use the “Volatility Hurdle” test. Disqualify any trade where the noise (1.5x ATR) exceeds your expected profit target, ensuring a minimum 1:1 Reward:Risk ratio before execution.
How to execute stop-loss orders with ATR in 2026?
Average True Range (ATR) execution enables traders to manage risk by dynamically adjusting stop-loss distances based on current market volatility rather than arbitrary fixed percentages. The Chandelier Exit mechanism uses ATR to construct trailing stops that tighten when a position moves into profit while maintaining sufficient distance to weather normal market fluctuations. A trader applying a 1.5x ATR multiplier to a position with current ATR of 25 pips sets the stop-loss 37.5 pips away from entry (25 × 1.5). As the trade moves into profit and ATR adjusts to 20 pips, the trailing stop automatically tightens to 30 pips (20 × 1.5), locking gains while protecting against reversals.
Momentum systems typically execute with 1.5x–2.3x ATR multipliers and achieve win rates between 63%-72% because the tighter stops limit downside while the multiplier prevents noise-driven exits. Trend-following strategies employ wider 2.5x–3.5x multipliers because trending moves require more price tolerance, a powerful trend move often encounters countertrend swings within the trend that would stop out a trader using momentum-sized risk parameters.
The “Ratchet” Strategy demonstrates advanced ATR execution by tightening multipliers as profit increases. A trader might enter with a 3.0x ATR stop-loss, then reduce it to 2.0x ATR once the position gains 50 pips, then further reduce to 1.0x ATR once gains reach 150 pips. This progressive tightening captures increasing portions of the move while dynamically protecting capital, early in a position when conviction remains uncertain, wider stops provide trading room, but once a trade has proven itself, progressively tighter stops lock in gains.
Real trading example: On March 8, 2026, a EUR/USD breakout trade was initiated with a 14-period ATR of 20 pips. The trader set the stop-loss at 1.5x ATR (30 pips) below the entry price. The position survived a 25-pip retrace that would have triggered a fixed 25-pip stop-loss, allowing the trade to capture its target before closing. Past performance is not indicative of future results.
The forex risk management and stop-loss placement framework details how ATR integrates into broader position sizing and portfolio risk management protocols.
ATR Efficiency Benchmarks and 2026 Multiplier Data
Average True Range (ATR) benchmarks reveal the optimal multipliers required to balance account security with profit capture across different asset classes. The data identifies clear separation between momentum-optimized multipliers and trend-following parameters, with crypto assets requiring substantially wider multipliers due to extreme intraday volatility.
| Strategy Type | Optimal Setting | Multiplier Range |
| Momentum Stop | Optimal Multiplier | 1.5x – 2.3x (Medium, 2025) |
| Trend-Following Stop | Optimal Multiplier | 2.5x – 3.5x (Aurra, 2025) |
| Stop-Out Reduction | Comparative Gain | 25% – 30% (Chartswatcher, 2025) |
| Crypto ATR Multiplier | Recommended Range | 3.0x – 4.0x (Binance, 2025) |
| Intraday Win Rate | ATR-Hedged Strategy | 63% – 72% (QuantLab, 2025) |
Sources: Data sourced from 2025-2026 backtesting reports by Chartswatcher and Aurra Markets.
The win rate differential demonstrates that traders employing ATR-adjusted stops achieve measurably higher probability of success than those using fixed risk parameters. The crypto multiplier premium reflects the structural reality that digital assets experience 5-10% intraday swings routinely, multipliers designed for forex pairs with 1-2% intraday moves would trigger continuous stops in crypto markets.
The Aurra Markets: Trend-Following Multipliers for Swing Traders verifies the trend-following multiplier ranges and provides detailed backtesting across multiple asset classes and volatility regimes.
What is a good ATR for trading?
Average True Range (ATR) value is considered “good” for trading when it represents a stable or expanding volatility regime that provides sufficient price movement for your profit targets. A “good” ATR depends entirely on whether the value supports your strategy’s profit objectives, a 50-pip ATR on EUR/USD provides ample movement for a day trader targeting 60-pip profits but insufficient movement for a swing trader expecting 200-pip moves. Conversely, a 10-pip ATR on EUR/USD creates noise for a swing trader but supplies ideal trading conditions for a scalper targeting 15-pip profits.
Low ATR conditions identify consolidation periods where price movement contracts into a narrow range. During low ATR regimes, traders shift from trend-following strategies (which require extended moves) to mean-reversion approaches (which profit from price bouncing between support and resistance). High ATR conditions reveal high momentum periods where directional moves extend substantially. During high ATR regimes, trend-following becomes profitable while mean-reversion strategies trigger frequent false signals because price moves push past traditional reversion levels.
The Volatility Hurdle test disqualifies low-probability trades by ensuring that your expected profit target exceeds the noise level (1.5x ATR). If a trader expects a 30-pip profit but the current 1.5x ATR equals 50 pips, the trade fails the hurdle test, the expected reward does not compensate for the risk of being stopped out by normal noise. This discipline prevents traders from entering low-probability setups that statistically underperform the risk taken.
The advanced stop-loss strategies resource covers additional risk management frameworks beyond ATR-based approaches.
How does ATR compare to Bollinger Bands and Parabolic SAR?
Average True Range (ATR) provides a pure volatility measurement, whereas Bollinger Bands and Parabolic SAR combine volatility with directional trend signals. ATR represents volatility in isolation, the indicator shows price intensity without identifying whether the volatility will expand further or compress. This pure volatility measurement enables traders to calculate risk parameters independent of directional conviction, creating a mathematical foundation for position sizing and stop-loss placement.
Bollinger Bands incorporate volatility through standard deviation calculations, measuring how much prices deviate from a moving average. Unlike ATR’s simple measurement of average price range, Bollinger Bands identify whether price has moved into statistically extreme territory relative to recent trading patterns. The bands expand when volatility increases and contract when volatility decreases, creating a dynamic envelope around prices that suggests mean reversion when price touches outer bands.
Parabolic SAR combines volatility-based calculations with directional momentum, generating trend reversal signals by tracking whether prices remain above or below an accelerating level. The SAR incorporates volatility considerations (wider SAR jumps during volatile periods, tighter jumps during calm periods) but primarily functions as a trend-following tool rather than a pure volatility measurement.
The momentum trading tools and strategies framework explains how ATR complements momentum indicators in identifying high-probability entries. Additionally, the Parabolic SAR and trend reversal signals documentation details how SAR mechanics create different entry and exit timing compared to ATR-based approaches.
The Binance Academy: Technical Indicators for Crypto Volatility verifies the crypto-specific recommendation for 3.0x-4.0x ATR multipliers and explains volatility regimes in digital asset markets.
Turn Knowledge into Profit
You have done the reading, now it is time to act. The best way to learn is by doing. Open a free, no-risk demo account and practice your strategy with virtual funds today.
Open a Free Demo Account💡 KEY INSIGHT: ATR’s greatest value emerges during high-volatility sessions, a 1.5x ATR stop automatically widens to accommodate market swings while maintaining discipline to protect capital.
Key Takeaways
- Average True Range (ATR) measures market volatility by calculating the average true range of price movement over a specific period.
- ATR-based trailing stops reduce premature stop-outs by up to 30% compared to fixed-pip risk management methods.
- ATR multipliers of 1.5x to 2.3x are identified as the efficiency ‘sweet spot’ for intraday momentum trading in 2026.
- ATR multipliers for crypto assets require a wider 3.0x to 4.0x range to account for 10% intraday price swings.
- ATR serves as the foundation for the ‘Volatility Hurdle’ test, used by quants to disqualify low-probability trades.
- ATR calculations must incorporate the previous day’s close to accurately measure volatility during market gaps.
Frequently Asked Questions
What our analysts watch. Three ATR signals separate noise from regime change. First, ATR contraction below the prior 90-day median often precedes a breakout, so we tighten triggers when realised range compresses. Second, ATR expansion that arrives without trend (price chops while range explodes) is a liquidity event, not an opportunity. Third, position size scales inversely to ATR. When EUR/USD ATR doubles into a central-bank week, we halve units to keep risk-per-trade flat. Volatility is the budget; price is the spend.
This article contains references to Average True Range (ATR) and Volity, a regulated CFD trading platform. This content is produced for educational purposes only and does not constitute financial advice or a recommendation to buy or sell any financial instrument. Always verify current regulatory status and platform details before using any trading service. Some links in this article may be affiliate links.
[/coi_disclosure]
Volity operates a trading platform and also publishes educational and analytical content about trading. The content on this page is for educational purposes only and should not be considered financial advice. Volity may benefit commercially when readers open trading accounts through links on this site.
Our content is produced and reviewed under documented editorial standards; comparison and review methodology is published here.