The Parabolic SAR indicator does not eliminate false signals or prevent losses during whipsaw ranges. Relying solely on SAR without confirmation filters results in rapid account depletion. Extreme volatility can cause SAR to flip multiple times in seconds, triggering stopped-out positions. Leverage amplifies losses on false exits. Past performance is not indicative of future results. Capital at risk.
The Parabolic SAR (Stop and Reverse) is a price-and-time-based indicator used to identify directional trends and precise exit points. Represented as a series of dots above or below price candles, it serves as a dynamic trailing stop that accelerates as a trend gains momentum. In 2026, this tool remains indispensable for trend-following strategies, provided it is used in conjunction with a strength filter like the ADX to avoid false signals in ranging markets.
The Parabolic SAR functions as one of the most effective tools for managing open positions in trending environments. This indicator identifies the precise moment where a trend’s momentum begins to decelerate, signaling a potential reversal. It serves as a visual trailing stop that protects capital without requiring subjective interpretation.
The 2026 trading landscape demands a sophisticated approach to technical filters to avoid the “whipsaw” effects of low-liquidity ranges. Mastering the acceleration mechanics of SAR allows investors to ride long-term moves with institutional-grade discipline.
While understanding Parabolic SAR is important, applying that knowledge is where the real growth happens. Create Your Free Forex Trading Account to practice with a free demo account and put your strategy to the test.
What is the Parabolic SAR indicator?
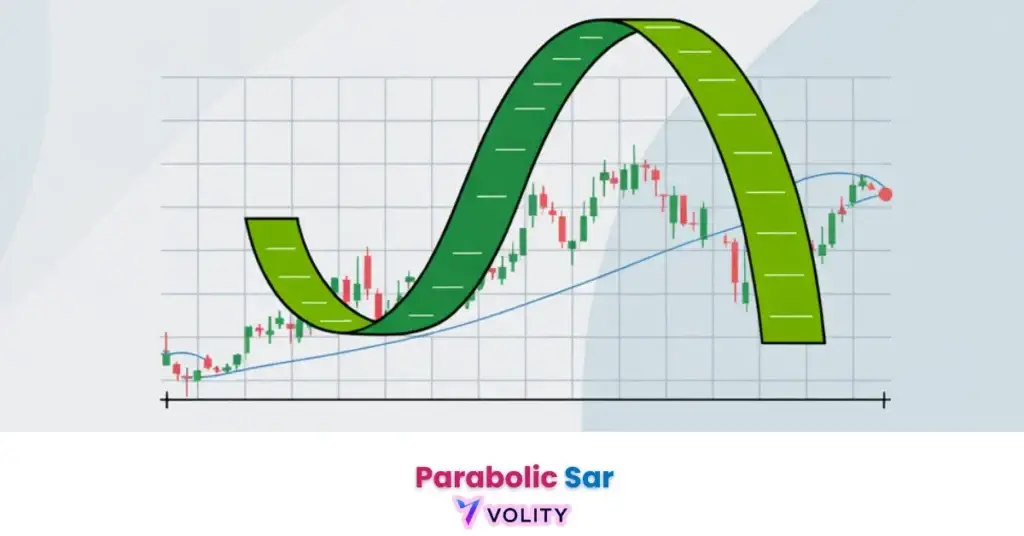
The Parabolic SAR is a trend-following indicator that identifies the current direction of an asset by placing dots either above or below the price candles. The acronym “Stop and Reverse” describes its dual function: acting as both an exit signal and a reversal entry point. Each dot represents the optimal stop-loss level for the current trending position.
Trading in OTC FX markets reached $9.6 trillion per day in April 2025, up 28% from $7.5 trillion three years earlier, according to the BIS 2025 Triennial Central Bank Survey of OTC foreign exchange turnover. Deep liquidity in the major pairs is what keeps SAR exits fillable close to the dot rather than several pips beyond it.
- Definition of “Stop and Reverse” (SAR) Logic: The indicator flips from below to above price when momentum shifts, signaling both an exit and a potential short entry.
- Visual Cues: Dots below = Bullish trend; Dots above = Bearish trend. This visual simplicity enables fast decision-making.
- The Concept of “Time Decay” in Technical Indicators: How SAR catches up to price as the trend matures. Eventually, the indicator and price converge at a flip point.
The Parabolic Curve and Momentum
A parabolic move is an exponential price acceleration where the gap between the SAR dots and the price candles narrows rapidly. This narrowing signals that the trend is reaching exhaustion. Acceleration Factors (AF) determine how quickly the indicator catches up. The “Extreme Point” (EP) mechanic records the highest high (uptrend) or lowest low (downtrend) since the current SAR inception.
Ready to Elevate Your Trading?
You have the information. Now, get the platform. Join thousands of successful traders who use Volity for its powerful tools, fast execution, and dedicated support.
Create Your Account in Under 3 MinutesThe Parabolic SAR Formula and Acceleration Factors
The SAR calculation determines the next dot’s placement based on the prior SAR, the acceleration factor, and the most recent extreme price point. The standard formula SAR = Prior SAR + AF × (EP – Prior SAR) governs all SAR calculations, where AF starts at 0.02, increases by 0.02 each time a new extreme point is recorded, and is capped at 0.20 (Parabolic SAR). Drawing a trend-line alongside the SAR dots can help confirm the strength of the move. The “Step” (0.02) and “Maximum” (0.20) values define how aggressively the indicator chases price.
The step size is a sensitivity dial, not a performance setting. A step of 0.01 makes the dots converge on price more slowly, so the trailing stop sits further away and survives ordinary pullbacks; 0.03 does the opposite. Wilder’s own guidance, restated in the Parabolic SAR reference, is 0.02 as the starting acceleration factor with 0.20 as the ceiling, and a lower 0.01 where a less sensitive stop is wanted.
How to trade with Parabolic SAR effectively?
Systematic SAR trading utilizes the “flip” signal to trigger entries while using the dots as dynamic trailing stop-loss levels. Bullish Signals occur when a dot prints below price after being above. The Trailing Stop Strategy involves moving your stop-loss bar-by-bar to the latest SAR dot, locking in profits as the trend matures. Exit Execution requires closing a position the moment the dot flips to the opposing side.
Worked illustration of the rule, not a recorded trade: a bullish SAR flip prints at 1.2500 with ADX at 28 and rising, so the ADX filter is satisfied and the long is taken. Price runs to 1.2750 and the dots trail it up. The bearish flip prints at 1.2700 and the position is closed there for 200 pips, giving back 50 pips from the high because a trailing stop always gives back the last leg. Past performance is not indicative of future results.
Settings Comparison: Standard vs. Optimized SAR
Indicator sensitivity identifies the trade-off between signal speed and protection against market noise in 2026 configurations. Conservative settings reduce whipsaws but trigger exits slower. Aggressive settings catch reversals quickly but generate false flips in ranges. Most traders optimize for their timeframe and asset class.
| Setting Type | Step (AF) | Maximum AF | 2026 Market Context | Trade-off |
| Conservative | 0.01 | 0.10 | High-Volatility Equity | Fewest whipsaws, latest exits |
| Standard | 0.02 | 0.20 | G10 Forex Majors | Wilder default balance |
| Aggressive | 0.03 | 0.30 | Scalping/M1 Charts | Fastest flips, most noise |
| Multi-TF | 0.015 | 0.15 | Swing Trading | Middle ground for swing holds |
The step and maximum values above are the standard configurations; the trade-off column describes indicator behaviour, not a backtested win rate.
Avoiding Whipsaws: The Role of ADX and Confirmation
Trend intensity filters identify the difference between a high-conviction breakout and a temporary price whipsaw in ranging conditions. The “ADX Filter” requires trading SAR signals only when ADX is above 25, confirming sufficient trend strength. Combining SAR with oscillators like the RSI Indicator or the stochastic indicator for directional bias ensures additional confirmation.
SAR fails in “Sideways” zones because the indicator is designed to always be in the market, resulting in “churn” when a trend is absent. The cost of frequent flipping without ADX confirmation depletes accounts rapidly.
The Future of Trend Following: SAR and AI in 2026
Artificial intelligence identifies non-linear acceleration factors that dynamically adjust the SAR formula based on real-time volatility clusters. Machine learning models optimize SAR settings by analyzing intraday volatility profiles. SAR application in Cryptocurrency markets (BTC/ETH volatility) has expanded with 2026 adoption of volatile asset trading.
Understanding trading-wedge-patterns provides additional structural context for these automated systems.
Turn Knowledge into Profit
You have done the reading, now it is time to act. The best way to learn is by doing. Open a free, no-risk demo account and practice your strategy with virtual funds today.
Open a Free Demo AccountKey Takeaways
- Parabolic SAR is a trend-following indicator that provides objective entry and exit signals through a series of dots.
- SAR signals are bullish when dots appear below the price action and bearish when they appear above the candles.
- Trailing stop-losses are the primary application of SAR, allowing traders to lock in profits as a trend matures.
- The acceleration factor (AF) determines how quickly the indicator catches up to price, increasing as the trend reaches new extremes.
- Whipsaws are common in ranging markets, making a trend-strength filter like the ADX mandatory for high-probability setups.
- 2026 optimizations suggest using a conservative AF of 0.01 to reduce premature exits in volatile, large-cap equity markets.
Frequently Asked Questions
This article contains references to the Parabolic SAR indicator, trend-following strategies, and Volity, a regulated CFD trading platform. This content is produced for educational purposes only and does not constitute financial advice or a recommendation to buy or sell any financial instrument. Parabolic SAR generates false signals in non-trending markets; always use confirmation filters like the ADX. Always test SAR strategies on a demo account before live deployment. Some links in this article may be affiliate links.