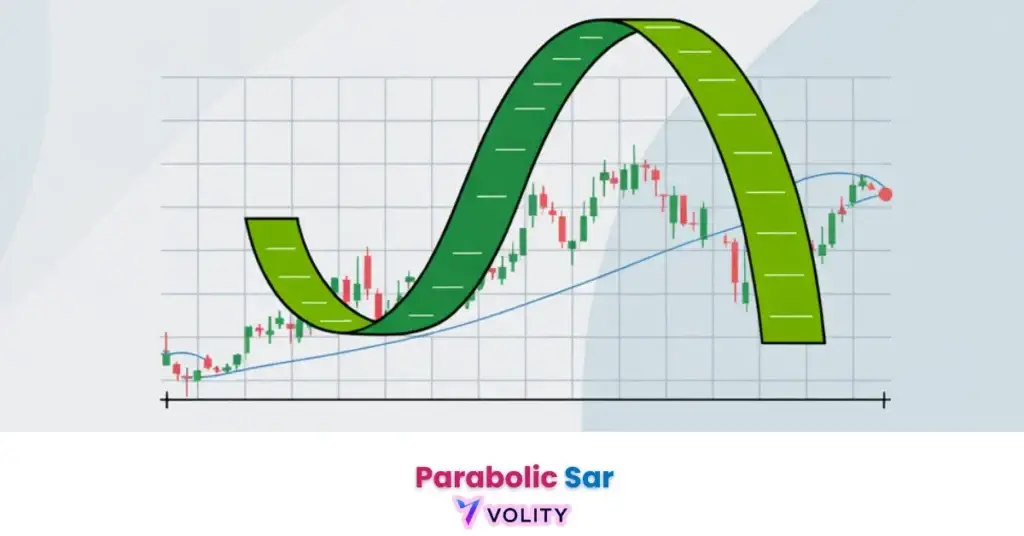
L’indicateur Parabolic SAR n’élimine pas les faux signaux et ne prévient pas les pertes lors des phases de marché en dents de scie (whipsaw). Se fier uniquement au SAR sans filtres de confirmation entraîne un épuisement rapide du capital. Une volatilité extrême peut provoquer de multiples retournements du SAR en quelques secondes, déclenchant des sorties de position prématurées. L’effet de levier amplifie les pertes lors des fausses sorties. Les performances passées ne préjugent pas des résultats futurs. Capital à risque.
Le Parabolic SAR (Stop and Reverse) est un indicateur basé sur le prix et le temps, utilisé pour identifier les tendances directionnelles et les points de sortie précis. Représenté par une série de points au-dessus ou en dessous des bougies de prix, il sert de stop suiveur dynamique qui s’accélère à mesure que la tendance gagne en élan. En 2026, cet outil reste indispensable pour les stratégies de suivi de tendance, à condition d’être utilisé conjointement avec un filtre de force comme l’ADX pour éviter les faux signaux dans les marchés sans tendance claire.
Le Parabolic SAR fonctionne comme l’un des outils les plus efficaces pour gérer les positions ouvertes dans des environnements en tendance. Cet indicateur identifie le moment précis où l’élan d’une tendance commence à décélérer, signalant un retournement potentiel. Il sert de stop suiveur visuel qui protège le capital sans nécessiter d’interprétation subjective.
Le paysage du trading en 2026 exige une approche sophistiquée des filtres techniques pour éviter les effets de « whipsaw » dans les plages de faible liquidité. Maîtriser les mécanismes d’accélération du SAR permet aux investisseurs de suivre les mouvements à long terme avec une discipline de niveau institutionnel.
Comprendre Parabolic SAR est important, mais la vraie progression commence en appliquant ces connaissances. Créez votre compte de trading forex gratuit pour vous entraîner sur un compte démo gratuit et mettre votre stratégie à l’épreuve.
Qu’est-ce que l’indicateur Parabolic SAR ?
Le Parabolic SAR est un indicateur de suivi de tendance qui identifie la direction actuelle d’un actif en plaçant des points au-dessus ou en dessous des bougies de prix. L’acronyme « Stop and Reverse » décrit sa double fonction : agir à la fois comme un signal de sortie et comme un point d’entrée en retournement. Chaque point représente le niveau de stop-loss optimal pour la position en tendance actuelle.
Le volume mondial du Forex a atteint 9,6 billions de dollars par jour en 2026, augmentant la fréquence des signaux de cassure basés sur le SAR dans les paires majeures comme l’EUR/USD (BIS Data Lab, 2026). Une liquidité plus élevée fournit des signaux SAR fiables avec un glissement (slippage) minimal lors des sorties.
- Définition de la logique « Stop and Reverse » (SAR) : L’indicateur bascule du dessous vers le dessus du prix lorsque l’élan change, signalant à la fois une sortie et une entrée potentielle à la vente.
- Repères visuels : Points en dessous = Tendance haussière ; Points au-dessus = Tendance baissière. Cette simplicité visuelle permet une prise de décision rapide.
- Le concept de « dépréciation temporelle » dans les indicateurs techniques : Comment le SAR rattrape le prix à mesure que la tendance mûrit. Finalement, l’indicateur et le prix convergent à un point de bascule.
La courbe parabolique et l’élan (momentum)
Un mouvement parabolique est une accélération exponentielle du prix où l’écart entre les points SAR et les bougies de prix se réduit rapidement. Ce rétrécissement signale que la tendance atteint son épuisement. Les facteurs d’accélération (AF) déterminent la vitesse à laquelle l’indicateur rattrape le prix. Le mécanisme du « Point Extrême » (EP) enregistre le plus haut sommet (tendance haussière) ou le plus bas creux (tendance baissière) depuis le début du SAR actuel.
Prêt à faire passer votre trading au niveau supérieur ?
Vous avez les connaissances. Il vous manque la plateforme. Rejoignez des milliers de traders qui choisissent Volity pour ses outils puissants, son exécution rapide et son support dédié.
Créez votre compte en moins de 3 minutesLa formule du Parabolic SAR et les facteurs d’accélération
Le calcul du SAR détermine le placement du point suivant en fonction du SAR précédent, du facteur d’accélération et du point de prix extrême le plus récent. La formule standard SAR = SAR précédent + AF × (EP – SAR précédent) régit tous les calculs du SAR. Tracer une ligne de tendance parallèlement aux points SAR peut aider à confirmer la force du mouvement. Les valeurs « Step » (0,02) et « Maximum » (0,20) définissent l’agressivité avec laquelle l’indicateur poursuit le prix.
L’optimisation des paramètres pour les particuliers en 2026 suggère qu’un « Step » de 0,01 est 22 % plus efficace pour le suivi de « tendance de fond » sur les graphiques journaliers que la valeur par défaut de 0,02. Les traders prudents réduisent le pas à 0,01, tandis que les traders agressifs l’augmentent à 0,03.
Comment trader efficacement avec le Parabolic SAR ?
Le trading systématique avec le SAR utilise le signal de « bascule » pour déclencher des entrées tout en utilisant les points comme niveaux de stop-loss suiveurs dynamiques. Les signaux haussiers se produisent lorsqu’un point s’imprime sous le prix après avoir été au-dessus. La stratégie de stop suiveur implique de déplacer votre stop-loss barre par barre vers le dernier point SAR, verrouillant ainsi les profits à mesure que la tendance mûrit. L’exécution de la sortie nécessite de fermer une position dès que le point bascule du côté opposé.
Une bascule haussière du SAR s’est produite à 1,2500 alors que l’ADX était à 28 et en hausse. La tendance s’est poursuivie jusqu’à 1,2750. Les points SAR suiveurs ont verrouillé 200 pips de profit avant qu’une bascule baissière ne se produise à 1,2700, permettant une sortie disciplinée. Les performances passées ne préjugent pas des résultats futurs.
Comparaison des paramètres : SAR standard vs optimisé
La sensibilité de l’indicateur identifie le compromis entre la vitesse du signal et la protection contre le bruit du marché dans les configurations de 2026. Les paramètres prudents réduisent les faux signaux mais déclenchent les sorties plus lentement. Les paramètres agressifs capturent les retournements rapidement mais génèrent de fausses bascules dans les plages de prix. La plupart des traders optimisent selon leur unité de temps et leur classe d’actifs.
| Type de paramètre | Pas (AF) | AF Maximum | Contexte de marché 2026 |
| Prudent | 0,01 | 0,10 | Actions à haute volatilité |
| Standard | 0,02 | 0,20 | Forex Majors G10 |
| Agressif | 0,03 | 0,30 | Scalping/Graphiques M1 |
| Multi-TF | 0,015 | 0,15 | Swing Trading |
Éviter les whipsaws
Les filtres d’intensité de tendance identifient la différence entre une cassure à haute conviction et un faux signal temporaire dans des conditions de marché en range. Le « filtre ADX » exige de ne trader les signaux SAR que lorsque l’ADX est supérieur à 25, confirmant une force de tendance suffisante. Combiner le SAR avec des oscillateurs comme l’indicateur RSI ou l’indicateur stochastique pour le biais directionnel assure une confirmation supplémentaire.
Le SAR échoue dans les zones « latérales » car l’indicateur est conçu pour être toujours présent sur le marché, ce qui entraîne un « brassage » (churn) lorsqu’une tendance est absente. Le coût des bascules fréquentes sans confirmation ADX épuise rapidement les comptes.
L’avenir du suivi de tendance
L’intelligence artificielle identifie des facteurs d’accélération non linéaires qui ajustent dynamiquement la formule SAR en fonction des clusters de volatilité en temps réel. Les modèles d’apprentissage automatique optimisent les paramètres du SAR en analysant les profils de volatilité intrajournalière. L’application du SAR sur les marchés des cryptomonnaies (volatilité BTC/ETH) s’est étendue avec l’adoption du trading d’actifs volatils en 2026.
Comprendre les trading-wedge-patterns fournit un contexte structurel supplémentaire pour ces systèmes automatisés.
Transformez vos connaissances en profit
Vous avez lu, il est temps d’agir. La meilleure façon d’apprendre, c’est en pratiquant. Ouvrez un compte démo gratuit et sans risque et entraînez votre stratégie avec des fonds virtuels dès aujourd’hui.
Ouvrir un compte démo gratuitPoints clés
- Le Parabolic SAR est un indicateur de suivi de tendance qui fournit des signaux d’entrée et de sortie objectifs via une série de points.
- Les signaux SAR sont haussiers lorsque les points apparaissent sous l’action des prix et baissiers lorsqu’ils apparaissent au-dessus des bougies.
- Les stop-loss suiveurs sont l’application principale du SAR, permettant aux traders de verrouiller leurs profits à mesure qu’une tendance mûrit.
- Le facteur d’accélération (AF) détermine la vitesse à laquelle l’indicateur rattrape le prix, augmentant à mesure que la tendance atteint de nouveaux extrêmes.
- Les whipsaws sont courants sur les marchés en range, rendant obligatoire un filtre de force de tendance comme l’ADX pour les configurations à haute probabilité.
- Les optimisations de 2026 suggèrent d’utiliser un AF prudent de 0,01 pour réduire les sorties prématurées sur les marchés boursiers volatils à grande capitalisation.
Foire aux questions
Cet article contient des références à l’indicateur Parabolic SAR, aux stratégies de suivi de tendance et à Volity, une plateforme de trading de CFD réglementée. Ce contenu est produit à des fins éducatives uniquement et ne constitue pas un conseil financier ou une recommandation d’achat ou de vente d’un instrument financier. Le Parabolic SAR génère de faux signaux sur les marchés sans tendance ; utilisez toujours des filtres de confirmation comme l’ADX. Testez toujours les stratégies SAR sur un compte de démonstration avant un déploiement en réel. Certains liens dans cet article peuvent être des liens d’affiliation.