Trading with technical indicators involves leverage risk and signal limitations. Moving averages lag price action and generate false signals in choppy markets. Past performance is not indicative of future results. Capital at risk.
The Exponential Moving Average represents one of the most widely used trend-following indicators in technical analysis, favored by retail traders and institutional algorithms alike. This indicator reveals market momentum by calculating a weighted average that prioritizes recent price action over historical data.
In 2026, EMA strategies dominate forex scalping, crypto momentum trading, and equity day trading due to their responsiveness and low computational overhead. Understanding EMA mechanics, optimal settings, and risk management around this indicator proves essential for professional traders.
While understanding Exponential Moving Average (EMA) is important, applying that knowledge is where the real growth happens. Create Your Free Forex Trading Account to practice with a free demo account and put your strategy to the test.
What is an Exponential Moving Average and how is it calculated?
An Exponential Moving Average identifies a trend-following indicator that assigns exponentially decreasing weights to historical prices, prioritizing recent market action.
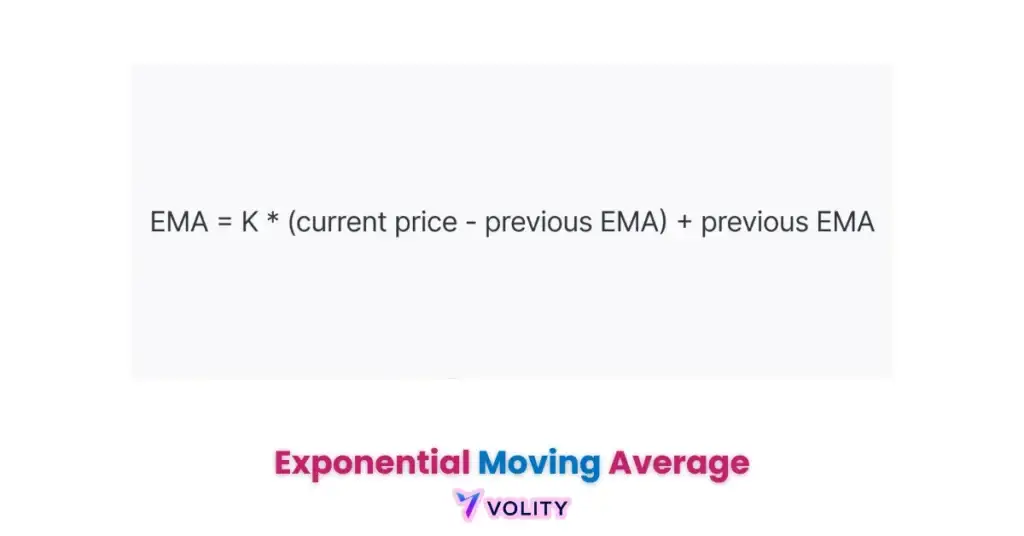
The EMA calculation begins with a simple moving average (SMA) for the first period, then applies a multiplier formula: EMA = Price × Multiplier + EMA(prior day) × (1 – Multiplier). The multiplier, calculated as 2 ÷ (Period + 1), determines how much weight recent prices receive.
A 10-period EMA applies a multiplier of 0.1818, meaning the newest closing price receives approximately 18% weight while the previous EMA receives 82%. This recursive calculation creates the “exponential” nature, each new price point influences not just the current EMA but all future calculations, creating a true weighted average.
The practical result: EMA responds to price changes approximately twice as fast as a Simple Moving Average (SMA) of the same period.
The trend-following strategies guide explains how EMA integrates into broader trend identification systems and momentum trading frameworks.
Ready to Elevate Your Trading?
You have the information. Now, get the platform. Join thousands of successful traders who use Volity for its powerful tools, fast execution, and dedicated support.
Create Your Account in Under 3 MinutesEMA vs SMA: Why Traders Prefer Exponential Over Simple Averages
For the slower-but-cleaner alternative, see our deep dive on the simple moving average (SMA), same purpose, different responsiveness curve.
The distinction between EMA and SMA identifies a fundamental trade-off between responsiveness (EMA’s advantage) and stability (SMA’s advantage).
SMA treats all prices equally over the lookback period, creating a smoother line that resists false breakouts but lags price action significantly. EMA emphasizes recent prices, responding to trend changes 5-8 bars faster than SMA.
This speed advantage proves invaluable in intraday trading where quick exits prevent catastrophic drawdowns, a 50-pip adverse move that SMA fails to recognize becomes a critical exit signal on EMA before equity damage accumulates. The trade-off emerges in choppy markets: EMA’s responsiveness triggers whipsaws more frequently than SMA, generating false signals that cost capital.
Professional traders therefore use context-dependent selection: EMA for momentum entry timing, SMA for range-bound confirmation and mean-reversion targeting.
The moving average crossover strategies guide documents how EMA and SMA combine in professional trading systems for enhanced signal reliability.
EMA Trading Strategies: Identifying Entries and Confirming Trends
EMAs pair well with the MACD indicator, which is itself built from two EMAs, confluence between price-cross and MACD-cross filters out most false signals.
EMA-based trading strategies operate through multiple methodologies: crossover trading, slope analysis, and confluence with support/resistance.
EMA Crossover Strategy executes buy orders when a fast EMA (9-period) crosses above a slow EMA (21-period), signaling transition from downtrend to uptrend. Research indicates 55-60% win rates when trades occur above major support levels.
Slope Analysis evaluates the angle of the EMA line: steep upward slope confirms strong bullish momentum while flattening slope signals trend exhaustion. Support and Resistance Confluence treats EMA as a dynamic support line in uptrends, price bouncing at the EMA provides high-probability entry opportunities.
Volume Confirmation on EMA bounces increases win rates by approximately 20%, indicating institutional participation rather than algorithmic fill trading.
The position sizing for traders guide explains how to calculate optimal position sizes for EMA-based trades considering volatility and account equity.
Optimal EMA Settings for Different Timeframes in 2026
EMA effectiveness depends critically on timeframe selection, identical EMA settings produce dramatically different results across 1-minute, 5-minute, hourly, and daily charts.
Scalping (1-5 minute charts) uses 5-9 period EMAs, responding to micro-movements and capturing intraday volatility spikes. Day Trading (15-minute to 1-hour charts) uses 10-21 period EMAs that filter noise while capturing 4-8 hour trend moves.
Swing Trading (4-hour to daily charts) uses 20-50 period EMAs identifying multi-day trend direction. The critical principle: EMA period should match your intended holding period, a 200-period EMA on a 1-minute chart serves no purpose because the trend it identifies plays out over days while your positions close within hours.
Settings misalignment represents the #1 reason traders fail with EMA systems.
Turn Knowledge into Profit
You have done the reading, now it is time to act. The best way to learn is by doing. Open a free, no-risk demo account and practice your strategy with virtual funds today.
Open a Free Demo AccountRisk Management Around EMA-Based Signals
Stop-loss placement and position sizing prove more important for EMA trading success than indicator optimization.
Stop-loss placement typically extends beyond the most recent swing low (uptrends) or swing high (downtrends), protecting against reversals that invalidate the EMA signal. The 1-2% risk rule limits losses to maximum 1-2% of account equity per trade, a framework where an EMA-based entry with a 50-pip stop on a $10,000 account risks only $100-$200. Risk-to-reward targets aim for 2:1 or 3:1 ratios where potential profit significantly exceeds potential loss. Drawdown management acknowledges that even 55-60% win rate strategies experience inevitable losing streaks, limiting consecutive losses to 3-5 before reassessing market conditions prevents account depletion during whipsaw clusters.
Key Takeaways
- Exponential Moving Averages weight recent prices more heavily, responding to trend changes approximately twice as fast as Simple Moving Averages.
- EMA-based systems achieve 55-60% win rates in trending markets when combined with volume confirmation and proper timeframe selection.
- The 9-period EMA on 5-minute charts has become the standard scalping tool in 2026 due to optimal responsiveness-to-noise ratio.
- EMA effectiveness depends critically on timeframe alignment, EMA periods should match intended holding duration to filter appropriate noise levels.
- Stop-loss placement beyond swing extremes and the 1-2% risk rule provide the primary defense against EMA whipsaws and drawdowns.
- EMA trading success depends more on discipline and risk management than indicator optimization or parameter fine-tuning.
Frequently Asked Questions
What our analysts watch. EMAs are useful as filters, fragile as triggers. Three rules keep them honest.
First, use slope, not crossover. A 50-EMA whose slope flips from negative to positive after a flat zone is a more reliable signal than a 50/200 cross that prints inside a range.
Second, demand price-and-EMA confluence. Long-only above a rising 200-EMA, short-only below a falling 200-EMA.
Trades that fight both are statistical donations. Third, never optimise period values per asset.
The whole point of a simple filter is generalisability; tuned EMAs almost always reflect curve-fit rather than insight, and degrade live.
This article contains references to exponential moving averages, technical analysis, and Volity, a regulated CFD trading platform. This content is produced for educational purposes only and does not constitute financial advice. Always test strategies on demo accounts before deploying live capital. Some links may be affiliate links.
[/coi_disclosure]
Volity operates a trading platform and also publishes educational and analytical content about trading. The content on this page is for educational purposes only and should not be considered financial advice. Volity may benefit commercially when readers open trading accounts through links on this site.
Our content is produced and reviewed under documented editorial standards; comparison and review methodology is published here.