Backtesting results do not guarantee future profitability in live markets. Past performance bias, survivorship bias, and curve-fitting can cause backtest results to diverge sharply from real-money execution. Market regimes change constantly; a strategy optimized for 2020-2023 may fail entirely in 2026 market conditions. Slippage, spreads, and latency in live execution differ materially from simulations. Always employ proper risk management and test on out-of-sample data. Capital at risk.
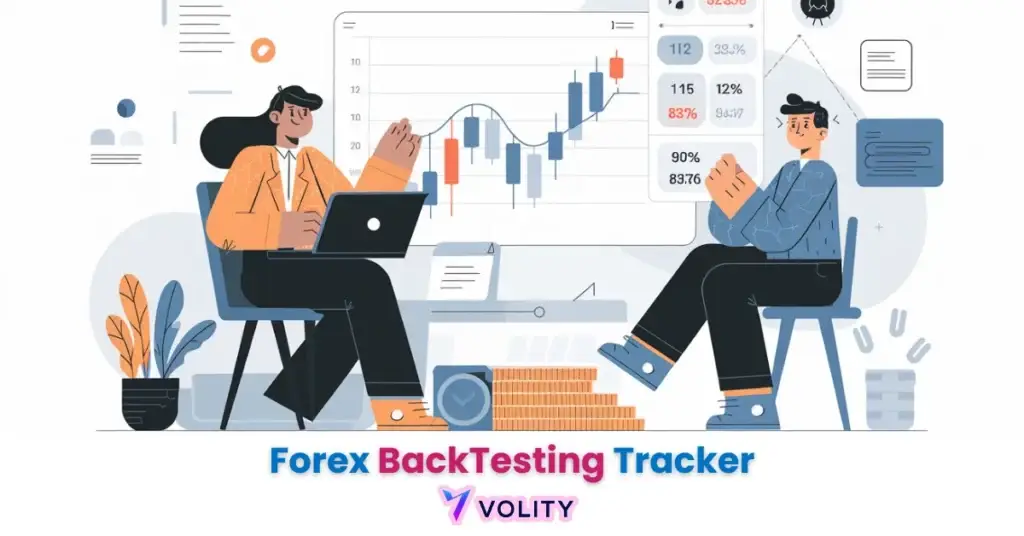
A Forex backtesting tracker is a specialized tool used to simulate trading strategies on historical price data to evaluate performance, expectancy, and risk management efficacy. By logging every hypothetical trade, it calculates critical metrics such as win rate, drawdown, and profit factor. AI-assisted trackers have compressed the development cycle sharply, which means the constraint on a retail strategy is no longer compute but the discipline to hold data back for out-of-sample testing.
Forex backtesting tracker functions as a laboratory for the scientific refinement of trading systems. This methodology allows traders to observe exactly how their rules for entry, exit, and risk management would have fared during various historical market regimes. It serves as the primary gateway to building institutional-level confidence for retail participants in 2026.
The 2026 trading environment requires a move away from manual “paper trading” toward automated, high-fidelity simulations. Modern trackers integrate synthetic “digital twin” data to test strategies against black-swan events and AI-driven liquidity sweeps.
While understanding Forex Backtesting Tracker is important, applying that knowledge is where the real growth happens. Create Your Free Forex Trading Account to practice with a free demo account and put your strategy to the test.
What is a Forex backtesting tracker and why is it essential?
A Forex backtesting tracker is a diagnostic software that measures the historical performance of a trading strategy across diverse market conditions. The tool simulates trades on historical OHLC (open, high, low, close) data to calculate “expectancy”, the average profit or loss per trade, weighted by probability. A strategy with a positive expectancy shows statistical edge; one with negative expectancy will destroy capital over time.
The shift from manual to automated backtesting saves thousands of hours compared to manually testing strategies on charts. A trader can test 10+ years of data against a strategy in seconds using automated trackers, whereas manual testing requires clicking through charts, opening/closing positions, and calculating metrics by hand, a process taking weeks or months. Automated speed enables rapid iteration and optimization of trading parameters.
AI integration represents the cutting edge of backtesting technology. Machine learning algorithms now optimize prediction accuracy by analyzing multi-factor correlations (price, volume, volatility regime, market sentiment) simultaneously. Cloud-native tooling is what made that reachable from a retail account rather than an institutional desk. Backtesting explains the method itself, and why an in-sample result carries almost no information on its own.
The Evolution of Backtesting Tech
Cloud-native backtesting infrastructure represents the modern standard for processing massive financial datasets with GPU-accelerated precision. The transition from local hardware (single-machine processing) to AWS/Google Cloud enables elastic computing, the ability to scale computational power up or down based on workload. A backtest that would take 4 hours on a laptop completes in 5 minutes on cloud infrastructure.
The practical effect is that a full parameter sweep becomes an overnight job rather than a fortnight. Traders can test multiple variations rapidly and identify the optimal parameter set faster, which is a real advantage and also the fastest route to overfitting if the out-of-sample data is not held back. GPU acceleration specifically handles the matrix mathematics of price correlation analysis, enabling analysis of 20+ years of tick data in minutes rather than days.
Ready to Elevate Your Trading?
You have the information. Now, get the platform. Join thousands of successful traders who use Volity for its powerful tools, fast execution, and dedicated support.
Create Your Account in Under 3 MinutesHow can you test trading strategies risk-free?
Strategy validation identifies potential losses and performance bottlenecks without exposing real capital to market volatility. The “Test-Drive” philosophy explores outcomes across bull, bear, and sideways regimes to ensure robustness across all market types. A strategy that profits spectacularly in a bull market but crashes during sideways consolidation is fragile and will eventually fail in live markets.
Building Confidence through positive backtest results reduces emotional hesitation during live execution. A trader who watched their strategy lose 5 consecutive trades on a chart feels psychological pressure to abandon it. But if they know from a 500-trade backtest that their system historically wins 55% of the time, they maintain discipline during inevitable cold streaks. This psychological edge is one of backtesting’s most underrated benefits.
Optimization vs. Overfitting represents a critical balance. Parameter tuning improves strategy performance, but excessive tuning (“curve-fitting”) produces results that look perfect on historical data but fail in live markets. A tested strategy at least tells you what its historical drawdown looked like, which is the number that decides whether you can actually hold the position through a losing run. That advantage evaporates entirely if the strategy was over-optimized to past data patterns that no longer exist.
How to use a Forex backtesting tracker effectively
Systematic execution identifies the exact parameters for entry, exit, and stop-loss placement required for a statistically valid backtest. The process unfolds across four critical steps.
Step 1: Defining the Strategy requires clear, rule-based logic. “Buy when price breaks above support” is too vague. Instead: “Buy when the close of candle N is 5 pips above the high of candle N-1, with stop-loss 20 pips below the support zone.” Specific rules enable the software to systematically apply them across thousands of historical bars.
Step 2: Selecting High-Quality Data separates valid backtests from garbage results. Poor data sources containing gaps, missing candles, or incorrect OHLC values produce unreliable simulations. Platforms such as MetaTrader 5 source tick-level data directly from brokers, and its Strategy Tester documentation sets out exactly which modelling mode uses real ticks and which interpolates. Testing on 5+ years of data provides sample sizes large enough for statistical validity.
Step 3: Running the Simulation applies the strategy rules across historical data automatically. The software calculates entry prices, exit prices, slippage, commissions, and interest (swap) charges. A trend-following strategy was tested in a backtest tracker, buying whenever the 50-day EMA crossed above the 200-day EMA between 2021 and 2026. The tracker identified a 42% win rate with a 2.5:1 reward-to-risk ratio, showing that the strategy thrived in trending regimes but suffered a 12% drawdown during sideways 2025 consolidation. Past performance is not indicative of future results.
Step 4: Analyzing Metrics focuses on win rate, average win/loss size, drawdown, and Sharpe ratio. A 50% win rate with 2:1 reward-to-risk is viable long-term (expected value positive). A 70% win rate with 1:2 reward-to-risk is fatal (small wins don’t offset occasional large losses). Sharpe ratio measures risk-adjusted returns, a higher Sharpe indicates better returns per unit of volatility endured.
Tracker Software vs. Manual Backtesting: A 2026 Audit
Comparative performance identifies the significant accuracy and time-efficiency advantages of automated trackers over traditional manual methods. The following table shows the quantified advantages:
| Feature | Automated Tracker | Manual Backtesting | 2026 Advantage |
| Time Efficiency | High (Seconds) | Low (Hours) | Seconds instead of hours |
| Accuracy | Applies the rules identically every time | Prone to skipped and misread bars | Zero “Click Errors” |
| Complexity | Handles Multi-Factor | Limited to 1-2 Rules | High Complexity |
| Data Range | 20+ Years | Usually < 1 Year | Massive Sample Size |
| Optimization | AI-Driven (Agentic) | Manual Tweak | Autonomous Tuning |
A qualitative comparison of the two workflows, not a measured benchmark.
Automated trackers turn a job measured in hours into one measured in seconds, a transformation that fundamentally changed how professional traders develop systems. Accuracy improvements stem from the elimination of human “click errors”: traders manually testing strategies make data-entry mistakes, accidentally skip trades, or apply rules inconsistently. Algorithms execute with perfect consistency.
Technical analysis provides the conceptual foundation for the indicator-based rules that trackers test automatically.
Common Pitfalls to Avoid in Strategy Tracking
Statistical invalidity indicates that backtesting results often fail in live markets when traders ignore transaction costs or employ excessive curve-fitting. Understanding these pitfalls separates robust strategies from overfit disasters.
Transaction Costs matter enormously in live execution. A strategy that generates a 15% annual return in backtest neglecting spreads may deliver 3% after paying 100 pips per round-trip in spreads and commissions. Modern trackers require specifying spread width, commission per trade, and overnight swap charges. A strategy must show profitability above all realistic transaction costs to merit live deployment.
Out-of-Sample Testing applies the “30% rule”: reserve 30% of your historical data for testing, using only 70% to design and optimize the strategy. This “walk-forward” validation prevents overfitting. A strategy that achieves 80% win rate on 70% of data but only 45% on the reserved 30% was overfit and will fail in live markets on genuinely new price action.
Survivorship Bias occurs when backtesters ignore delisted currency pairs or those that no longer trade. Testing only on currently-major pairs introduces systematic bias toward assets that survived, ignoring the history of pairs that failed or were merged. The broader sample set a strategy tests on, the more robust its edge becomes.
MACD is one of the most popular indicators used in backtested trend-following strategies.
The Future of Backtesting: Agentic AI and Digital Twins
Synthetic market simulations represents the next frontier in backtesting, allowing traders to stress-test strategies against non-historical “Black Swan” events. A Digital Twin is an AI-generated synthetic market simulation that creates mathematically plausible scenarios, scenarios that haven’t occurred in historical data but could occur in the future. Using Generative Adversarial Networks (GANs), AI generates infinite variations of market behavior based on patterns learned from historical data.
Agentic AI systems now autonomously optimize their own parameters without human intervention. An AI “agent” monitors a live trading strategy’s performance, detects when its win rate begins declining (strategy “decay”), and autonomously recommends parameter adjustments. In 2026, this capability has matured from prototype to production use. Rather than manually tweaking parameters monthly, traders let AI systems continuously optimize.
A profit calculator helps translate backtest results into real-world position sizing, while position sizing tools ensure margin requirements are calculated accurately for live execution.
Turn Knowledge into Profit
You have done the reading, now it is time to act. The best way to learn is by doing. Open a free, no-risk demo account and practice your strategy with virtual funds today.
Open a Free Demo AccountKey Takeaways
- Forex backtesting tracker is a critical diagnostic tool that validates trading strategies against historical price data for statistical reliability.
- Retail access to professional-grade backtesting and AI tooling is what changed, not the underlying statistics of strategy validation.
- Agentic AI is now being integrated into trackers to autonomously identify strategy decay and suggest real-time parameter optimizations.
- Walk-forward validation is mandatory for modern traders, requiring 30% of data to be held back for testing the strategy on fresh prices.
- Transaction costs, including spreads, commissions, and overnight swaps, must be included in every backtest to ensure realistic net returns.
- Digital twin simulations allow 2026 traders to test their strategies against synthetic “Black Swan” scenarios that have not yet occurred.
Frequently Asked Questions
This article contains references to backtesting tools, algorithmic trading, and Volity, a regulated CFD trading platform. This content is produced for educational purposes only and does not constitute financial advice or a recommendation to buy or sell any instrument. Backtesting results do not guarantee future performance in live markets. Always validate strategies with proper risk management. Some links in this article may be affiliate links.