Piercing Line patterns can fail when price gaps exceed the pattern’s structural levels during overnight or weekend sessions, invalidating the gap-down rule. A “partial” piercing that closes below the midpoint of the first candle’s body does not meet the pattern definition at all and should not be traded as one. Institutional “stop runs” at common Piercing Line entry points can trigger stop-losses before the reversal acceleration begins. Trading Piercing Lines near major support without volume confirmation exposes traders to mechanical bounces that reverse sharply. Past performance is not indicative of future results. Capital at risk.
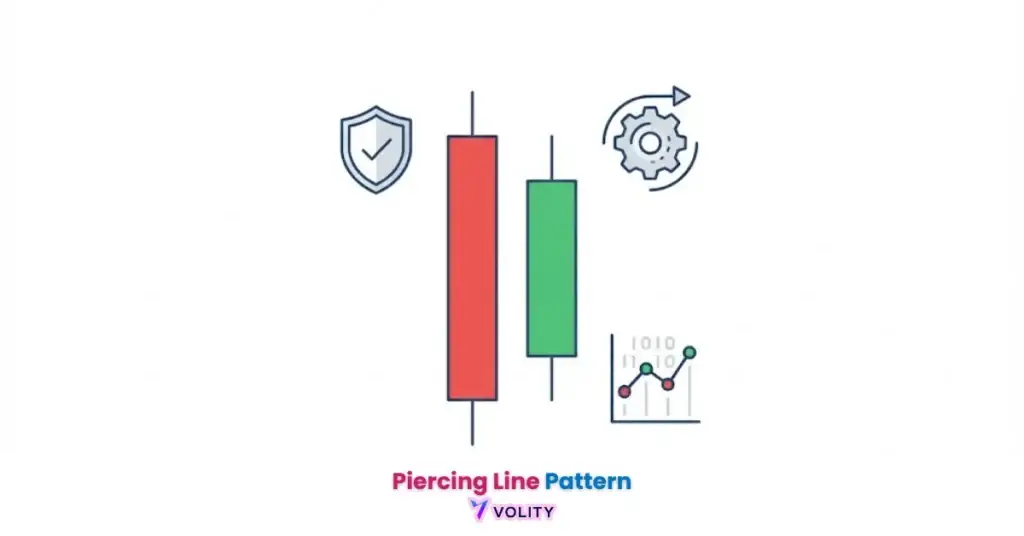
The Piercing Line is a two-candle bullish reversal pattern that prints at the conclusion of a downtrend. It is characterized by a long bearish candle followed by a bullish candle that opens with a significant gap down but closes more than 50% into the previous candle’s real body. In 2026, this formation is a primary signal for identifying market bottoms, especially when it aligns with institutional demand zones or weekly pivot supports.
The Piercing Line pattern functions as one of the most reliable visual cues in Japanese candlestick patterns for identifying potential market bottoms. This formation identifies the moment where bearish momentum exhausts and buyers decisively reclaim the majority of the preceding session’s losses. Modern technical analysis desks categorize this pattern as a “Tier-2” reversal signal, slightly below the Bullish Engulfing but above the Morning Star in momentum terms. It serves as a foundational entry signal for reversal traders across all liquid asset classes.
The 2026 trading landscape utilizes precise quantitative filters to distinguish genuine Piercing Line signals from temporary price fluctuations. Mastering the structural requirements of the “Midpoint Rule” allows investors to navigate volatile markets with objective entry and exit parameters.
While understanding Piercing Line Pattern is important, applying that knowledge is where the real growth happens. Create Your Free Forex Trading Account to practice with a free demo account and put your strategy to the test.
What is a Piercing Line candlestick pattern?
The Piercing Line is a two-candle bullish reversal pattern identifies the end of a downtrend through a strong bullish penetration of a previous bearish body.
This pattern captures the precise moment when sellers exhaust their pressure and institutional buying emerges. The visual metaphor is apt, buyers “pierce” through the sellers’ body, literally pushing price higher. Modern technical analysis desks categorize this pattern as a “Tier-2” reversal signal, slightly below the Bullish Engulfing but above the Morning Star in momentum terms.
- The visual metaphor: The “piercing” of the existing bearish sentiment
- Significance of the Gap Down: Representing the final “washout” of sellers
- Bearish vs. Bullish: Why the pattern is strictly a reversal signal at the lows
The Psychology of the Washout
A market washout is a price event where late-stage sellers are trapped by a sudden surge in institutional buying interest.
Exhaustion of supply occurs when the lowest prices attract value-driven institutional capital that overwhelms remaining sellers. This washout event is often the most violent price move of the downtrend, signaling capitulation. The emergence of high-volume buy-side liquidity confirms that the panic selling has ended and a reversal is likely sustainable.
Ready to Elevate Your Trading?
You have the information. Now, get the platform. Join thousands of successful traders who use Volity for its powerful tools, fast execution, and dedicated support.
Create Your Account in Under 3 MinutesAnatomy of the Piercing Line: The Two-Candle Rules
The Piercing Line formation requires a long bearish candle followed by a bullish candle that closes above the 50% midpoint of the first candle. Mastering how to read candlesticks is essential for verifying these exact structural requirements.
Candle 1 must be tall and bearish, confirming the existing downtrend context. A short bearish body fails to establish true downtrend conviction and weakens the reversal signal. Candle 2 opens with a “Gap Down” rule, opening below the close of Candle 1. This gap represents sellers pushing price lower on the open, revealing their last attempt at control.
The midpoint is what defines the pattern. The standard description of a Piercing Line is a bearish candle followed by a bullish candle that opens below the low of the preceding one and closes more than halfway into its body. Unlike a single candlestick pattern which may be a simple price spike, the Piercing Line provides structural reversal confirmation.
How to trade the Piercing Line pattern effectively?
Successful Piercing Line trading strategies utilizes volume confirmation and structural demand zones to validate the reversal entry.
Entry occurs at the close of Candle 2 when the midpoint penetration is confirmed, or on a breakout of the high of Candle 1 with sustained buying momentum. Stop-loss placement sits below the lowest wick of the second candle, protecting against pattern failure. Utilizing the RSI Indicator provides essential confirmation, the indicator should move from <30 (oversold) to >30 during the pattern formation, confirming that momentum has genuinely shifted.
Real trading example: EUR/USD formed a Piercing Line at a multi-month demand zone of 1.0500 with Candle 2 closing at 1.0580 (well above the 50% midpoint). The price reversed from 1.0500 and rallied 150 pips to the next resistance at 1.0650, providing a 4:1 risk-reward ratio. Past performance is not indicative of future results.
Piercing Line vs. Dark Cloud Cover: Identifying Inflections
The Piercing Line and Dark Cloud Cover identifies the critical inflection points between bullish and bearish market regimes.
Mirror-image patterns reveal the contrast between reversals. The Dark Cloud Cover appears at the top of an uptrend, signaling bearish reversal, with the first candle bullish and the second bearish closing into the first body. The Piercing Line appears at the bottom of a downtrend with the first candle bearish and second bullish closing above the midpoint. These opposing patterns function as inflection zone markers for the entire market structure.
| Characteristic | Piercing Line Pattern | Dark Cloud Cover Pattern |
| Market Context | Bottom of Downtrend | Top of Uptrend |
| Signal Type | Bullish Reversal | Bearish Reversal |
| First Candle | Long Bearish | Long Bullish |
| Opening of 2nd | Gap Down (0.3%+) | Gap Up (0.3%+) |
| Closing of 2nd | Above Midpoint (50%+) | Below Midpoint (50%+) |
Dark Cloud Cover explains the mirror-image pattern in detail.
Understanding both patterns ensures traders can recognize reversals in both directions with equal precision and confidence.
Avoiding False Signals: The Gap and Midpoint Filters
Structural location and tick-significant gaps identifies the difference between a high-conviction Piercing Line and a generic bullish bar.
The 0.3% tick rule applies to 24-hour markets where true gaps are rare. Small overnight gaps lack significance and don’t satisfy the gap-down requirement. Volume analysis reveals critical context, if volume falls on Candle 2, it suggests profit-taking rather than genuine accumulation by smart money.
Using the 200-period EMA confirms the long-term trend direction, ensuring the Piercing Line aligns with higher-timeframe bias.
Turn Knowledge into Profit
You have done the reading, now it is time to act. The best way to learn is by doing. Open a free, no-risk demo account and practice your strategy with virtual funds today.
Open a Free Demo AccountPsychology of Reversal Trading in 2026
Cognitive discipline ensures that traders do not pre-empt the bullish reversal before the second candle’s body close confirms the Piercing signal. Applying institutional Risk Management frameworks is essential for surviving the inevitable failures in bottom-fishing strategies.
Overcoming “bottom fishing” traps requires patience. Traders who enter on the gap-down opening of Candle 2 expose themselves to the risk that the day closes lower (partial piercing), failing the pattern. Adhering to the trading plan means waiting for body close confirmation, even when price starts showing strength during the session. The stop-loss at the pattern low remains non-negotiable to protect capital against reversal failures.
Key Takeaways
- Piercing Line patterns are two-candle bullish reversals that signal the transition from bearish dominance to buying conviction.
- Candle identification requires a long red bar followed by a bullish bar that opens lower but closes above the 50% midpoint.
- The Midpoint Rule is the strict non-negotiable threshold for pattern validity, requiring at least 50% penetration into the prior body.
- Gap down openings are essential in 2026, with a 0.3% tick-significant gap serving as the standard for 24-hour liquid markets.
- Volume confirmation is critical, with high-conviction setups showing a 1.5x surge in buying volume on the second candle.
- Structural confluence at established demand zones or major moving averages significantly increases the pattern’s success rate.
Frequently Asked Questions
This article contains references to Piercing Line Pattern and Volity, a regulated CFD trading platform. This content is produced for educational purposes only and does not constitute financial advice or a recommendation to buy or sell any financial instrument. Piercing Line patterns can fail when gap requirements are not met or when price closes below the midpoint threshold. Always test Piercing Line strategies extensively on demo accounts before committing real capital. Some links in this article may be affiliate links.