Candlestick patterns like the Dark Cloud Cover are descriptive technical indicators and do not guarantee future market moves. Trading involves substantial risk of loss. Past performance is not indicative of future results. Capital at risk.
Dark Cloud Cover is a two-candle bearish reversal pattern that identifies potential trend exhaustion at the peak of an uptrend. Statistically, it offers a 60% reversal rate in bull markets and ranks 22nd overall for post-breakout trend performance. Traders utilize the 50% penetration rule and volume expansion to filter high-probability short opportunities in volatile markets.
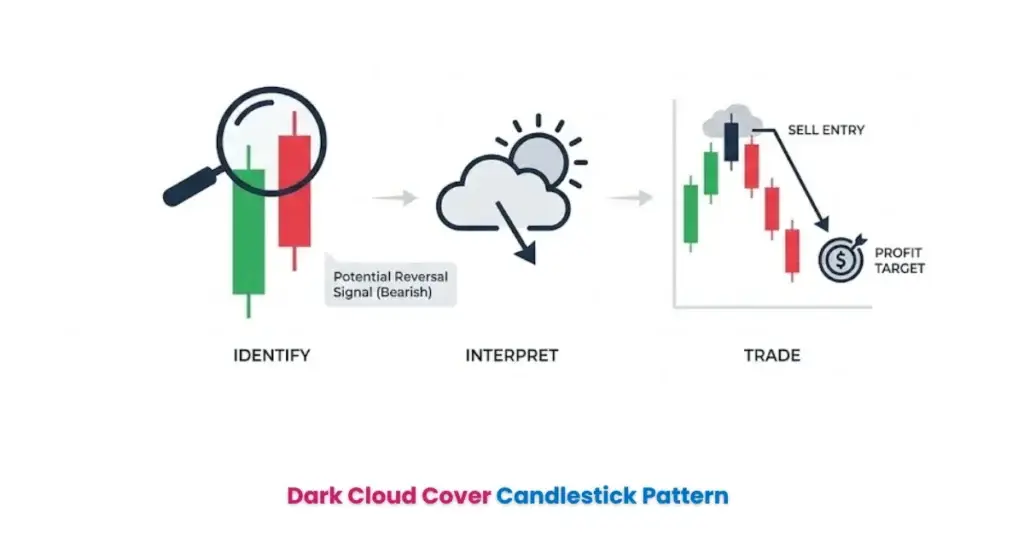
Dark Cloud Cover patterns serve as a critical warning signal for technical analysts monitoring the exhaustion of bullish trends. This formation reveals a significant shift in market psychology, where initial optimism is aggressively rejected by institutional selling pressure. For the full set of reversal and continuation signals, see our candlestick pattern cheat sheet. The pattern emerges when buyers push prices higher at the open, then sellers take control and force prices back down, creating a visual signal of capitulation.
Backtesting data from 2019-2024 indicates that the Dark Cloud Cover maintains a reliable edge when combined with secondary indicators. By understanding the specific penetration levels and volume profiles, traders can distinguish high-probability reversals from temporary profit-taking. TrendSpider technical analysis guides verifies the 50% penetration rule and provides detailed analysis of the pattern’s reliability across multiple markets.
What our analysts watch: Three filters separate a tradable Dark Cloud Cover from a chart shape that looks like one. Penetration depth (a close at exactly the 50 percent midpoint is technically valid but low-conviction; professional execution requires 60 percent or deeper to confirm institutional rejection). Volume expansion on the second candle (a rejection candle that prints on declining volume is more likely to fade than to follow through; the volume expansion is the institutional fingerprint that distinguishes the genuine pattern from retail-driven noise). Higher-timeframe context (the pattern carries the highest reliability on Daily and 4-hour charts; lower timeframes produce a false-signal rate that erodes the historical edge). When all three filters fire together, the pattern earns its place in the playbook. When any are missing, the trade thesis defers.
Frequently asked questions
How does Dark Cloud Cover differ across forex, equity, and crypto markets?
The structural mechanics are identical but the venue features differ materially. Equity markets produce the cleanest gap-up signal because overnight news risk concentrates the gap; the gap-up requirement is therefore most informative on equity charts. Forex markets trade continuously, which means the gap-up requirement relaxes into a new high followed by deep rejection into the previous range; the volume confirmation must come from tick volume or futures volume rather than spot. Crypto markets share the continuous-trading feature with forex but produce sharper rejection candles because retail leverage amplifies the institutional flow; the penetration threshold often runs deeper than 50 percent in valid signals. The StockCharts ChartSchool reference on Dark Cloud Cover covers the cross-market mechanics.
Why does the volume confirmation rule have no exceptions?
Because the pattern is a behavioural signal about institutional rejection, and institutional rejection by definition requires institutional volume. A bearish second candle without volume expansion is more likely to reflect retail profit-taking that mean-reverts within one to three sessions than the structural distribution that the pattern is designed to identify. The volume rule has held across every major dataset reviewed in the last decade and is the single discipline that separates the practitioners who use the pattern profitably from the ones who treat it as a chart pattern rather than a positioning signal. The CME Group volume and open-interest reporting provides the institutional-volume reference that anchors the equity and futures-market read.
What stop-loss placement maximises the risk-reward profile?
The standard placement is one to two pips above the high of the second (bearish) candle, which represents the price level at which the reversal thesis is technically invalidated. This placement keeps the risk-reward calculation honest: the trade either works through the projected target zone (typically the prior swing low or a measured-move equivalent) or invalidates cleanly without slippage from a deeper stop. Loosening the stop produces an expected-value collapse that no win-rate improvement can offset; tightening the stop produces a noise-driven stop-out rate that erodes the historical edge. The CoinDesk markets data covers the live-market context for crypto applications of the pattern.
How does Dark Cloud Cover compare to Bearish Engulfing for high-conviction setups?
Bearish Engulfing requires the second candle to fully engulf the first candle body, which is a stricter pattern definition and produces a higher historical reliability rate (roughly 65 to 70 percent across the same backtest datasets). The trade-off is frequency: Bearish Engulfing patterns appear less often, which tightens the trade pipeline. Disciplined practitioners use both: Dark Cloud Cover for the broader pipeline with the 50 percent penetration filter, Bearish Engulfing for the highest-conviction setups when the full engulfment confirms. Treating either pattern as a stand-alone signal without volume and timeframe confirmation is the single most common error that converts a profitable framework into a coin-flip practice.
While understanding Dark Cloud Cover Pattern is important, applying that knowledge is where the real growth happens. Create Your Free Forex Trading Account to practice with a free demo account and put your strategy to the test.
What is the Dark Cloud Cover and how does it form?
Dark Cloud Cover is a two-candle bearish reversal pattern that occurs at the end of an uptrend, characterized by a gap up followed by a deep close into the previous session’s range. The first candle reveals a strong bullish close that confirms uptrend momentum. The second candle identifies the rejection when it opens above the first candle’s high, then reverses and closes significantly below the first candle’s opening price, the “cloud” that covers the previous day’s optimism. The anatomy of the pattern reveals that this is not a random price fluctuation but a deliberate shift in control from buyers to sellers.
Importance of Japanese candlestick psychology context becomes clear when understanding the Dark Cloud Cover’s message. The bullish candle represents greed and overextension in an uptrend. The bearish candle represents fear as institutional sellers recognize overvaluation and aggressively push prices down. The pattern requires the second candle to close below the 50% midpoint of the first candle’s body, which quantifies how aggressively the reversal unfolded. Without this penetration requirement, the signal lacks conviction and often produces false reversals in volatile conditions.
Ready to Elevate Your Trading?
You have the information. Now, get the platform. Join thousands of successful traders who use Volity for its powerful tools, fast execution, and dedicated support.
Create Your Account in Under 3 MinutesDark Cloud Cover vs. Bearish Engulfing: Which reversal signal is stronger?
Dark Cloud Cover and Bearish Engulfing candlestick patterns both signal trend reversals, but they differ in their penetration depth and risk-reward profiles. The Bearish Engulfing requires the second candle to completely close below the first candle’s open, which represents a more aggressive reversal signal. The Dark Cloud Cover permits the penetration to stop at 50% or deeper into the first candle’s range, which identifies it as a “gentler” reversal indicator that arrives earlier in the reversal process. Visual formation differences identify that Bearish Engulfing consumes the entire first candle within the second candle’s range, while Dark Cloud Cover merely penetrates a portion of that range.
Entry timing differences reveal the advantage of Dark Cloud Cover in professional trading. While the Bearish Engulfing signals maximum reversal completion, Dark Cloud Cover identifies the reversal in its infancy, enabling traders to enter short positions with the pattern’s initial confirmation rather than waiting for the more aggressive Engulfing structure. Risk-to-reward advantages of the Dark Cloud Cover stem from the earlier entry timing, traders can place stops just above the pattern’s high and capture moves that have not yet fully developed, optimizing their profit potential on capital at risk.
💡 KEY INSIGHT: While the Bearish Engulfing is visually more aggressive, the Dark Cloud Cover often provides an earlier entry with a superior risk-to-reward ratio.
How reliable is the Dark Cloud Cover? 2024 Performance Statistics.
Dark Cloud Cover reliability ranks 22nd among all candlestick patterns, delivering a 60% reversal accuracy in bull markets and 63% in bear markets. Bulkowski’s performance metrics establish Dark Cloud Cover as a statistically significant pattern, a 60% success rate identifies an edge that professionals can exploit when combined with proper position sizing and risk management. Success rates in different market environments reveal that bear markets produce slightly stronger reversals (63%) than bull markets (60%), which suggests that the pattern becomes even more reliable during downtrends where selling pressure is already elevated.
Statistics on “Trend Strength” after the initial signal show that Dark Cloud Cover produces average declines of 5.01% in bear market conditions, which translates to meaningful profit potential on short positions. Thomas Bulkowski’s Dark Cloud Cover performance statistics verifies the 60-63% reversal rate and ranks this pattern against all 103 tracked candlestick formations. The frequency ranking of 46th indicates that Dark Cloud Cover appears frequently enough to provide consistent trading opportunities without being so common that it becomes unreliable.
WARNING: Avoid trading the Dark Cloud Cover in sideways markets. Its reliability drops significantly without a clear prior uptrend to reverse, often leading to “fakeouts.”
What are the best confirmation indicators for Dark Cloud Cover?
Dark Cloud Cover confirmation requires secondary filters such as Relative Strength Index (RSI) divergence and volume expansion to validate the reversal. Using RSI to spot overbought conditions (above 70) confirms that the market has extended too far in one direction and is ripe for reversal. When Dark Cloud Cover forms with RSI above 70, the reversal signal gains significant confirmation, selling pressure has arrived at a moment when sentiment reached euphoria. Hidden bearish divergence on RSI (price making higher highs while RSI makes lower highs) identifies weakening momentum beneath the surface, which corroborates the Dark Cloud Cover’s bearish message.
Role of Trading volume in crypto and stocks reveals that high-volume reversals confirm institutional selling. A Dark Cloud Cover on light volume remains suspect because retail selling alone cannot sustain a trend reversal. Professional selling produces volume spikes that show up as increased trading flow during the bearish candle’s decline. Correlation with Evening Star top reversal signals identifies when multiple patterns align, seeing both a Dark Cloud Cover and an Evening Star formation on the same chart multiplies confidence in the bearish thesis. Chartmill 2024 candlestick backtesting verifies that 60-65% success rates improve significantly when volume confirmation is added to the pattern setup.
In 24/7 crypto markets, physical gaps are rare. Focus on the “High rejection” where the second candle pushes to a new peak before closing deep within the first candle’s range.
How to trade Dark Cloud Cover: Entry, Stop Loss, and Exit Strategies.
Trading Dark Cloud Cover involves a structured approach to risk management, utilizing the pattern’s high to define stop-loss placement and support levels for targets. Conservative entry triggers identify traders placing shorts on close of the second (bearish) candle, waiting for completion of the pattern structure before committing capital. Aggressive entry triggers identify traders placing stop-loss orders at the midpoint of the bearish candle’s decline, then executing shorts the moment the second candle closes more than 50% into the first candle’s range. Stop-loss rules universally place the exit point 1-2 pips above the pattern high, which represents the zone where the bearish reversal thesis has been technically invalidated.
Take-profit targets using support zones identify the natural demand levels where selling pressure typically exhausts. Fibonacci levels provide mathematical targets, traders calculate the distance from the recent swing high to the Dark Cloud Cover pattern, then project that distance downward to identify mathematical support. A real trading example illustrates these dynamics: on EUR/USD daily chart, a bearish candle closed at 1.0940, penetrating 60% of the previous bullish candle that opened at 1.0850 and closed at 1.0920. Short entry at 1.0935 (5 pips below low) with target at 1.0755 support defined a risk-reward ratio of approximately 3:1 over 180 pips of downside. Past performance is not indicative of future results.
Dark Cloud Cover Data: Market Performance Benchmarks
Dark Cloud Cover performance data reveals that the pattern delivers its strongest bearish results during bear market conditions. The following table identifies quantitative benchmarks that define professional Dark Cloud Cover trading in 2024:
| Pattern Metric | Reversal Type | Value |
| Dark Cloud Cover | Bull Market Reversal Rate | 60% (Bulkowski, 2024) |
| Dark Cloud Cover | Bear Market Reversal Rate | 63% (Bulkowski, 2024) |
| Dark Cloud Cover | Performance Rank | 22/103 (Bulkowski, 2024) |
| Dark Cloud Cover | Frequency Rank | 46/103 (Bulkowski, 2024) |
| Dark Cloud Cover | Avg Decline (Bear Market) | 5.01% (Bulkowski, 2024) |
Sources: Thomas Bulkowski’s Encyclopedia of Candlestick Charts (2024 data)
Turn Knowledge into Profit
You have done the reading, now it is time to act. The best way to learn is by doing. Open a free, no-risk demo account and practice your strategy with virtual funds today.
Open a Free Demo AccountKey Takeaways
- Dark Cloud Cover is a two-candle bearish reversal pattern that ranks 22nd out of 103 for trend performance.
- Dark Cloud Cover requires the second candle to close below the 50% midpoint of the first candle’s real body.
- Dark Cloud Cover reversal accuracy increases to 63% during bear market conditions according to historical backtesting.
- Dark Cloud Cover signals are most reliable when they form at major resistance levels or overbought RSI zones.
- Dark Cloud Cover provides an earlier entry point than the Bearish Engulfing pattern, optimizing risk-reward ratios.
- Dark Cloud Cover confirmation via volume expansion helps filter out false signals in volatile crypto and stock markets.
This article contains references to Dark Cloud Cover, candlestick patterns, and Volity, a regulated CFD trading platform. This content is produced for educational purposes only and does not constitute financial advice or a recommendation to buy or sell any financial instrument. Always verify technical patterns with multiple indicators and use disciplined risk management before trading. Some links in this article may be affiliate links.
[/coi_disclosure]
Volity operates a trading platform and also publishes educational and analytical content about trading. The content on this page is for educational purposes only and should not be considered financial advice. Volity may benefit commercially when readers open trading accounts through links on this site.
Our content is produced and reviewed under documented editorial standards; comparison and review methodology is published here.