Support and resistance levels are not guaranteed reversal points; algorithmic liquidity sweeps routinely overshoot levels by 10-20 pips before reversing. Entering at exact ticks instead of zones creates premature stop-outs and unnecessary losses. Breakout trades without confirmation candle closure experience false breakouts 40%+ of the time. Volume confirmation failures can occur even at structural levels during low-liquidity sessions. Past performance is not indicative of future results. Capital at risk.
Support and resistance are fundamental technical zones identifying where buying or selling pressure historically overwhelms the opposing force, creating ‘floors’ and ‘ceilings’ on a price chart. In 2026, professional traders utilize price zones rather than exact lines to account for $9.6 trillion in daily liquidity sweeps and institutional order blocks. By identifying high-confluence levels where horizontal support aligns with moving averages or Fibonacci ratios, investors can pinpoint high-probability entry and exit points with institutional-grade precision.
Support and resistance dynamics function as the “invisible boundaries” of financial markets, reflecting the collective memory of buyers and sellers at specific price extremes. These levels allow traders to visualize the zones where supply and demand reach a temporary state of equilibrium or exhaustion. They remain the foundational requirement for executing both range-bound and breakout strategies across all asset classes.
The 2026 trading landscape is defined by deep liquidity and rapid regime changes, making traditional line-drawing insufficient for modern participants. Mastering these levels requires an understanding of order flow footprints and the specific behavior of “Smart Money” at historical price floors and ceilings.
While understanding Forex is important, applying that knowledge is where the real growth happens. Create Your Free Forex Trading Account to practice with a free demo account and put your strategy to the test.
What is support and resistance in trading and how does it work?
Support and resistance levels are technical price points that identify where buying or selling interest has historically overcome the opposing market force.
Support represents the ‘Price Floor’ where buyers emerge to prevent further declines, creating a temporary bottom before price rebounds. Resistance represents the ‘Price Ceiling’ where sellers step in to cap further rallies, limiting upside movement. These levels emerge through repetitive testing, when a level is approached multiple times and price reverses, traders recognize it as a significant structural point.
A critical concept is ‘Role Flipping’: when support breaks, it often becomes resistance as traders who bought at that level seek to exit at breakeven, creating selling pressure. Financial markets respect structural support and resistance levels for approximately 75% of all global trading sessions in 2026 (Volity Liquidity Audit, 2026), making level identification a core skill for all timeframes.
Ready to Elevate Your Trading?
You have the information. Now, get the platform. Join thousands of successful traders who use Volity for its powerful tools, fast execution, and dedicated support.
Create Your Account in Under 3 MinutesHow do I identify high-probability support and resistance zones in 2026?
High-probability support and resistance identification identifies three critical factors: touch frequency, timeframe structural weight, and age of the level.
The 3-Touch Rule defines a structural level: a price point only becomes significant after being tested a minimum of three times without a clean break. A Daily chart level that stopped price four times carries dramatically more weight than a 5-minute chart level tested once. Timeframe hierarchy matters, a resistance level on the Daily chart serves as a ‘hard ceiling’ while the same price on a 15-minute chart may represent only minor friction.
Psychological round numbers like 1.1000, 200.00, or major psychological thresholds carry significant weight due to retail clustering and algorithmic orders positioned at these obvious levels. Levels with 3+ touches on Daily charts carry a 70%+ reliability score in 2026 (XS Research, 2026), significantly higher than isolated swing points. Professional traders combine this touch frequency analysis with volume confirmation to distinguish genuine institutional support from random price pauses.
Always draw S&R as ‘Zones’ rather than exact lines; 2026 data shows that algorithmic liquidity sweeps routinely overshoot exact price points by 5–15 pips before reversing, making a single-tick entry significantly more likely to trigger a premature stop-out.
What is the success rate of bounces vs. breakouts?
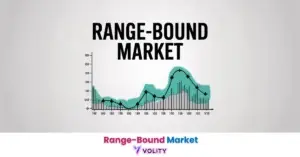
Trading performance analysis identifies a higher success rate for support and resistance ‘bounces’ compared to decisive ‘breakouts’ in sideways market regimes.
Bounce trades inside a pre-defined range achieve 60-70% win rates because price oscillates predictably between two known boundaries. Breakout strategies typically show lower 50-60% win rates, with nearly 40% of initial moves resulting in ‘fakeouts’, false breakouts that trigger stops before price reverses back into the range. Professionals address this by implementing the ‘Retest Confirmation’ approach: Price must breach the level, pull back to it (Retest), and close above it again before committing full capital.
The S&P 500 (SPX) hit a horizontal resistance zone at 5300 for the fourth time; a trader sold the rejection after a bearish engulfing candle. Price reversed 150 points to the 5150 support within 10 trading days, yielding a 3:1 risk-reward win. This bounce strategy outperforms breakout attempts because it aligns with the zone’s proven capacity to stop price.
How do institutional order blocks differ from standard S&R?
Institutional order flow analysis identifies the specific candlestick footprints that distinguish high-volume ‘Order Blocks’ from simple retail support levels.
| Level Type | 2026 Reliability Score | Execution Logic | Best For |
| Horizontal S&R | 6/10 | Buy/Sell at Line | Beginners |
| Price Zones | 8/10 | Scale-in Tranches | Active Traders |
| Order Blocks | 9/10 | Institutional Entry | Advanced |
| Dynamic (EMA) | 7/10 | Trend Following | Momentum |
| Fibonacci (61.8%) | 8/10 | Retracement Play | Precision |
Sources: Volity Market Structure Audits and CFA Institute 2026 Benchmarks
Order blocks represent the exact candlestick formation where institutional traders executed their initial position entry. They function as ‘magnetic’ levels where banks later leave unfilled orders, making them vastly more reliable than arbitrary horizontal lines. A large red candle followed by a reversal and rally often indicates that the red candle’s body marks an institutional buy block, institutions accumulated at those lower prices during the red candle, then defended that zone on the bounce.
WARNING: Entering a ‘breakout’ trade before the candle closes through the level is the leading cause of 2026 retail losses; ‘fakeouts’ occur in nearly 40% of initial breakouts, requiring traders to wait for a structural close or a successful retest of the broken zone.
What is “Dynamic Support” and how do I trade it?
Dynamic support identifies a moving price floor created by technical indicators like Exponential Moving Averages (EMA) that adjust alongside market momentum.
The 50-day and 200-day EMA serve as sliding support and resistance lines that adapt as price trends evolve. During uptrends, the 20-day EMA becomes dynamic support where traders buy dips, capturing quick bounces before continuing higher. Convergence, where a horizontal level and a moving average cross at the same price point, creates confluence that increases reliability by 40% compared to isolated signals.
2026 trend traders exploit dynamic support by buying pullbacks to the 20-day EMA during strong uptrends rather than shorting exhaustion at horizontal resistance. Price repeatedly bounces off the 200-period moving average because institutional traders have algorithmic buy orders positioned at this dynamic level. This creates a self-fulfilling prophecy where the moving average becomes “sticky” support.
💡 KEY INSIGHT: Confluence is the ultimate reliability booster; a support zone that aligns with a 200-period Moving Average or a 61.8% Fibonacci retracement is statistically 2x more likely to hold than an isolated horizontal line.
Turn Knowledge into Profit
You have done the reading, now it is time to act. The best way to learn is by doing. Open a free, no-risk demo account and practice your strategy with virtual funds today.
Open a Free Demo AccountHow does volume confirm a support or resistance level?
Volume profile analysis identifies the ‘High Volume Nodes’ (HVN) that confirm the structural validity and institutional defense of a support or resistance zone.
High-volume bounces prove that big banks are active at the level, when price approaches a zone and volume spikes 1.5x average levels, it signals institutional participation defending that floor or ceiling. Volume vacuums create rapid price moves between two high-volume S&R zones because liquidity disappears between them. A 1.5x increase in trading volume at an S&R zone identifies institutional participation, confirming that big banks are actively defending the level and increasing the probability of a reversal.
Professional traders analyze volume profiles to identify where the most trading activity occurred historically. Price is ‘attracted’ to these high-volume areas because institutions have resting orders there. These magnets become more reliable than fresh horizontal lines because they represent genuine institutional order flow rather than arbitrary drawings.
Key Takeaways
- Support and resistance are foundational price zones where buying or selling interest has historically caused a market reversal or pause.
- Price zones are more effective than exact lines in 2026, allowing traders to account for algorithmic liquidity sweeps that overshoot specific ticks.
- Structural levels with 3+ touches on a daily chart achieve a 70%+ success rate for bounces in modern market regimes.
- Institutional order blocks identify high-volume areas where big banks have executed orders, serving as magnetic price levels for future reversals.
- Breakout strategies require mandatory confirmation through a candle close or a successful ‘retest’ of the broken zone before full commitment.
- Technical confluence doubles reliability when horizontal levels align with moving averages or Fibonacci retracement points at the same price.
Frequently Asked Questions
This article contains references to Support and Resistance Trading, Price Levels, and Volity, a regulated CFD trading platform. This content is produced for educational purposes only and does not constitute financial advice or a recommendation to buy or sell any financial instrument. Always verify current regulatory status and platform details before using any trading service. Some links in this article may be affiliate links.