The candlestick inverted hammer is one of four candles built from a small body and a single long wick. On this one the long wick sits above the body, the body hugs the low of the session, and it tends to appear at the bottom of a downtrend, where it hints at a bullish turn. The catch is that three other candles share the exact same outline, so a glance at the shape alone can point you the wrong way. This guide is about identifying it correctly: the anatomy, the wick-to-body proportions, and how it differs from its look-alikes.
What is a hammer candlestick?
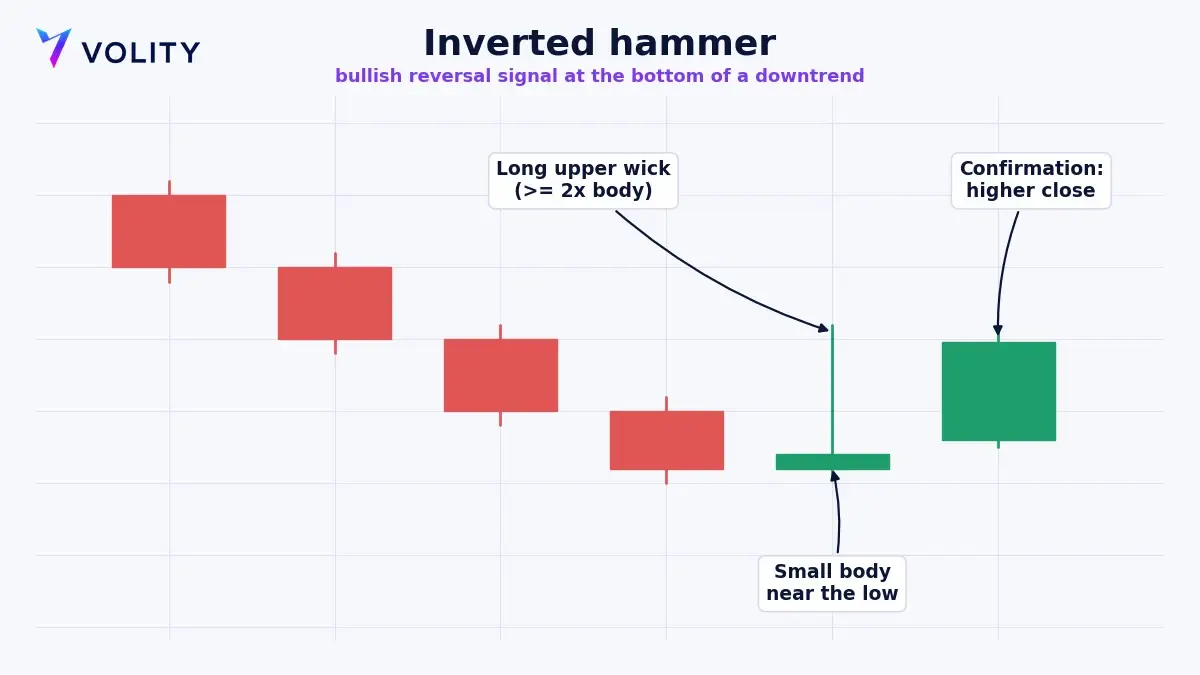
A hammer candlestick is any candlestick with a small real body and one long wick that runs at least about twice the length of that body, with little or no wick on the opposite side. The compact body and the long tail together look a bit like a hammer, which is where the name comes from. Shrink the body down to almost nothing and you no longer have a hammer at all; you have a doji, a separate single-bar signal.
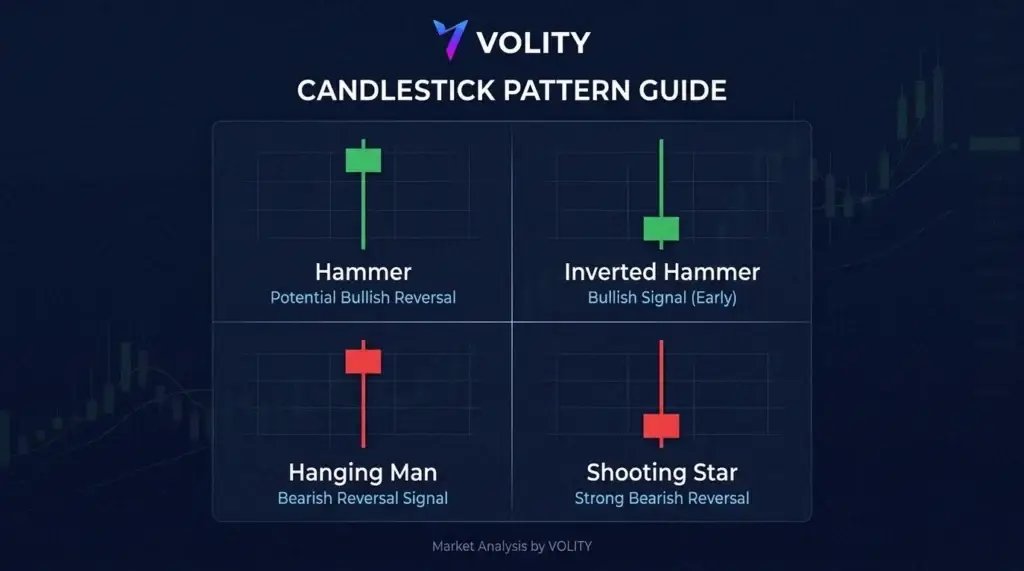
The proportions are the whole test. Measure the body from open to close, then measure the long wick. If the wick is roughly two to three times the body or more, and the other end of the candle is nearly flat, the shape qualifies. What that shape does not tell you is the signal. The same outline means different things depending on two questions: is the long wick below the body or above it, and did the candle print after a fall or after a rally. Those two questions produce four named candles, and mixing them up is how traders end up buying what they should be selling. The broader hammer candlestick pattern family is worth learning as a set for that reason.
What does the hammer candlestick mean?
The hammer candlestick meaning comes from rejection. A long wick shows that price travelled a fair distance one way during the session, then got pushed back before the close. That snap-back is the clue that the side in control is starting to meet real resistance from the other side of the book.
At the bottom of a downtrend, rejection of lower prices points to a possible bullish reversal. At the top of an uptrend, rejection of higher prices points to a bearish one. Either way the candle is a warning that momentum may be changing hands, and on its own it settles nothing. Every candle in this family wants confirmation from the candle that follows before you treat it as a signal rather than a maybe.
What are the four hammer-shaped candles?
These four candles share one silhouette and split apart on where the long wick sits, and where the candle appears in the trend. This table is the key to telling them apart.
| Candle | Long wick | Appears at | Signal |
| Hammer | Below the body | Bottom of a downtrend | Bullish reversal (bullish hammer candlestick) |
| Inverted hammer | Above the body | Bottom of a downtrend | Bullish reversal |
| Hanging man | Below the body | Top of an uptrend | Bearish reversal (bearish hammer candlestick) |
| Shooting star | Above the body | Top of an uptrend | Bearish reversal |
Read down the table and the pattern is easy to hold in your head. The hammer and the inverted hammer are the bullish pair at market bottoms. The hanging man and the shooting star are the bearish pair at market tops. Each bullish candle has a bearish twin with an identical shape, and the only thing separating the twins is where they show up in the trend. That is why position matters more than the picture.
Where does the candlestick inverted hammer fit in?
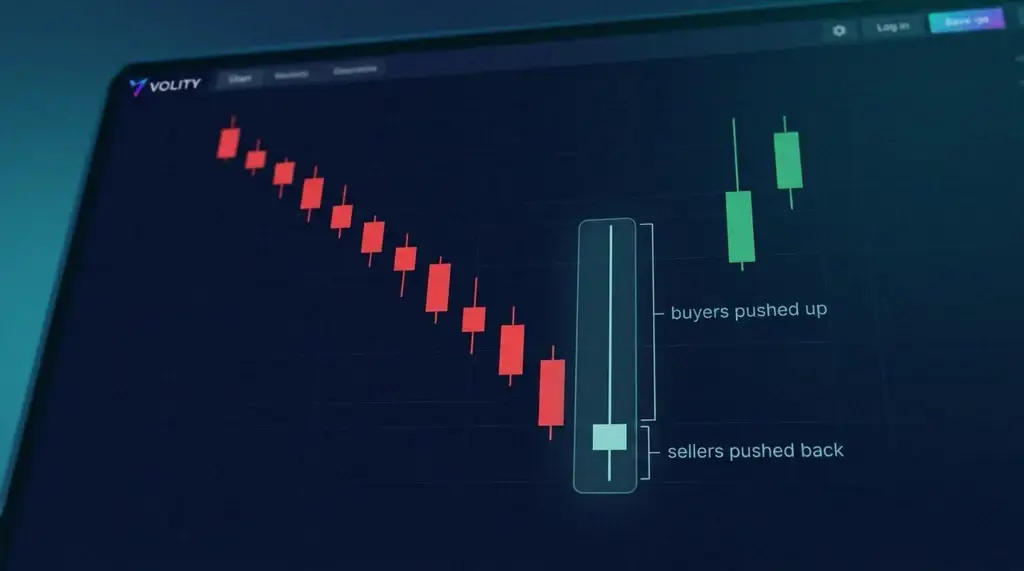
The candlestick inverted hammer is the bullish member of the family whose long wick points up. It forms at the bottom of a downtrend, and the long upper wick is the story: buyers drove price up hard during the session before sellers dragged it back down near the low. The inverted hammer candlestick meaning is that buyers are testing the water. If the next candle closes higher, that test starts to look like a floor.
Its bearish twin is the shooting star, the very same shape sitting at the top of an uptrend instead. This is the single most common mistake made with the candlestick pattern inverted hammer: reading the shape and skipping the trend. Trading that specific candle step by step is a subject in its own right, and one our dedicated inverted hammer guide covers separately; here the job is spotting it and telling it apart from its twin. If you want the wider method around it, our primer on technical analysis sets the context.
Red hammer vs green hammer: does colour matter?
Body colour is a minor factor next to shape and location. A green hammer candlestick closes above its open, and a red hammer candlestick closes below it. For a standard hammer at the bottom of a downtrend, a green body is marginally more encouraging because buyers finished the session in front, but both colours point at the same potential reversal.
The same goes for the inverted hammer: a red body and a green body both flag a possible bullish turn when the candle sits at the bottom of a decline. Do not let a red body scare you off a valid bullish setup, and do not talk yourself into a bearish read just because a hammer closed red. A genuinely bearish hammer shape is the hanging man or the shooting star, and what makes those bearish is their spot at a top, not the colour of the body.
How do you trade hammer candlestick patterns?
Once you have identified which candle you are actually looking at, the routine is much the same across the family.
- Identify the candle first. Check where the long wick sits and which way the market has been trending, since that is what makes the signal bullish (hammer, inverted hammer) or bearish (hanging man, shooting star).
- Insist on a location. The hammers worth trading sit at support for the bullish pair, or at resistance for the bearish pair, rather than floating in the middle of a range.
- Wait for confirmation. Let the next candle close in the signalled direction, or watch for price to break the hammer’s high on a bullish setup or its low on a bearish one.
- Enter on that break and place a protective stop just beyond the far end of the wick.
- Set a target at the next structural level or a fixed reward-to-risk multiple, and trail the stop if the move keeps running.
Volume adds weight to all of this. A hammer that forms on heavier-than-average volume carries real participation behind the rejection, which makes the reversal more believable than the same shape printed on a thin, quiet session.
What are the limitations of hammer candles?
Every candle in this family is a single-bar signal, and single bars are the least reliable class of pattern going. Without confirmation they fail often, and inverted hammer candlestick patterns in particular turn up constantly in choppy, high-volatility conditions where they mean very little. Reading the shape and ignoring the trend around it is the quickest way to give money back on them.
Treat a hammer as one input among several. Line it up with support and resistance, the direction of the larger trend, a volume check, and where useful a second confirming pattern such as an engulfing candle on the next bar. It also helps to know the wider set of reversal candlestick patterns so a hammer is not the only tool you reach for. On leveraged products such as CFDs, an unconfirmed reversal that fails can move against you quickly, so a stop beyond the wick and a fixed risk per trade are not optional. The candle marks a level; your risk plan does the protecting.
How can you trade hammer setups on Volity?
Volity is an all-in-one money hub that keeps your wallet, payments, and trading in one account. The charting inside Volity MT lets you mark support and resistance, pick out any candle in the hammer family across 40+ forex pairs plus global indices, commodities, and crypto, and attach a stop-loss and take-profit as you open a position, so your risk is fixed before any confirmation arrives. A free demo lets you rehearse the identification on virtual funds first.
Because the family holds both bullish and bearish signals, it fits naturally with two-directional CFD trading, where you can take the hammer long and the shooting star short. Leverage goes up to 1:500 (product-dependent) on selected instruments, with the margin shown before every order and negative balance protection in place. Treat that as a capability rather than a target: leverage magnifies losses as fast as gains, so size the position to the stop rather than to the maximum available. Execution is regulated by CySEC under UBK Markets, licence 186/12, and you can check the published charges and fees for the full cost picture before you fund.
Related patterns
Frequently asked questions
What is the difference between a hammer and a candlestick inverted hammer?
Both are bullish candles at the bottom of a downtrend, and both have a small body with one long wick. The difference is which side the wick is on: the hammer’s long wick hangs below the body, while the candlestick inverted hammer’s long wick stands above it. Both still need the following candle to confirm them before you treat either as a valid signal.
Is a red hammer candlestick bearish?
Not on its own. A red hammer candlestick simply closed below its open. Sitting at the bottom of a downtrend it is still a potential bullish reversal, just a touch weaker than a green one. A truly bearish hammer shape is the hanging man or the shooting star, and those earn the bearish label by appearing at the top of an uptrend, not by their colour.
What is the inverted hammer candlestick meaning?
The inverted hammer candlestick meaning is a possible bullish reversal. Forming at the bottom of a downtrend, its long upper wick shows buyers pushing price up before sellers forced it back near the low. If the next candle closes higher, it confirms that buyers are regaining control and the downtrend may be running out of road.
How reliable are inverted hammer candlestick patterns?
On their own, inverted hammer candlestick patterns are only moderately reliable, because single-bar signals fail fairly often. Reliability climbs when the candle forms at support, is backed by higher volume, and is confirmed by the next candle. Traders who wait for that confirmation instead of buying the hammer as it prints tend to get considerably better results.