The inverted hammer is a single candlestick that signals a possible bullish reversal when it forms at the bottom of a downtrend. It has a small body near the low of the bar and a long upper wick, like a hammer turned upside down. On its own it is only a hint, and it needs a higher close on the next candle to confirm the turn.
What is an inverted hammer candlestick?
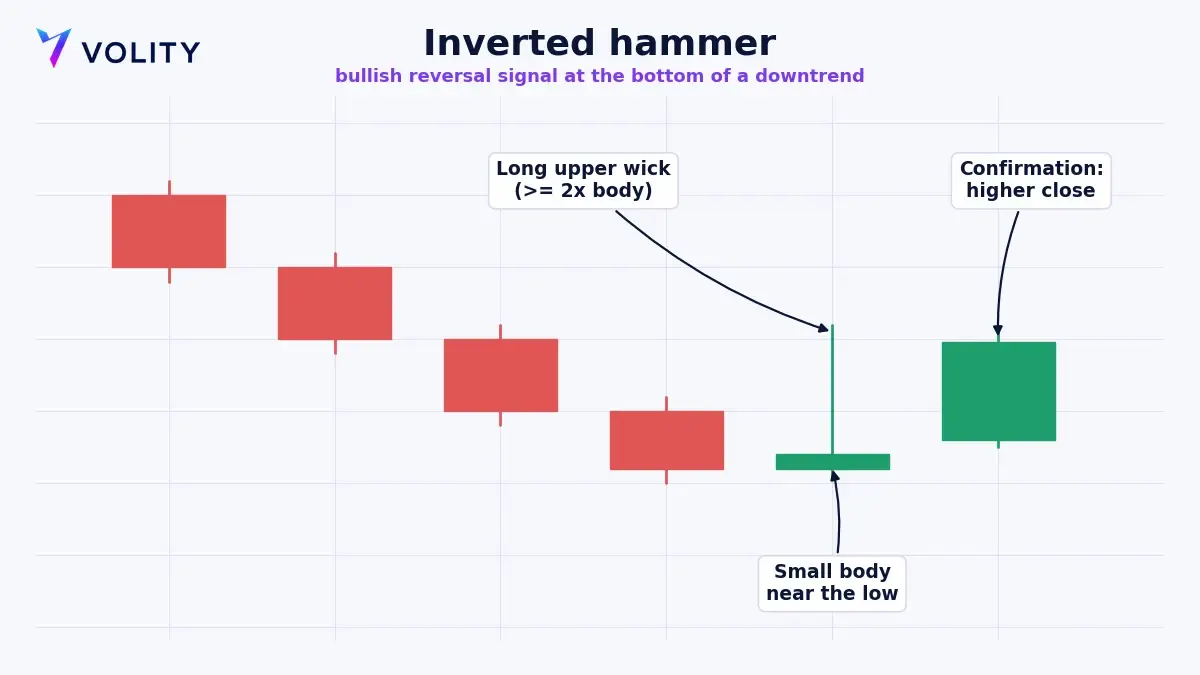
An inverted hammer candlestick is a single-bar pattern with three defining features: a small real body sitting near the bottom of the range, a long upper shadow at least twice the height of the body, and little or no lower shadow. That shape, a short body with a tall wick above it, is where the name comes from. Charting references group it with the wider hammer family of single-candle reversals, and the candlestick pattern inverted hammer looks exactly like the hammer candlestick flipped vertically.
Location is what makes it meaningful. An inverted hammer candle only carries a bullish message when it appears after a clear downtrend, at or near a support level. The same shape in the middle of a range says very little. The inverted hammer candlestick pattern is a reversal signal, and like other reversal candlestick patterns it needs a prior trend to reverse.
What does an inverted hammer signal?
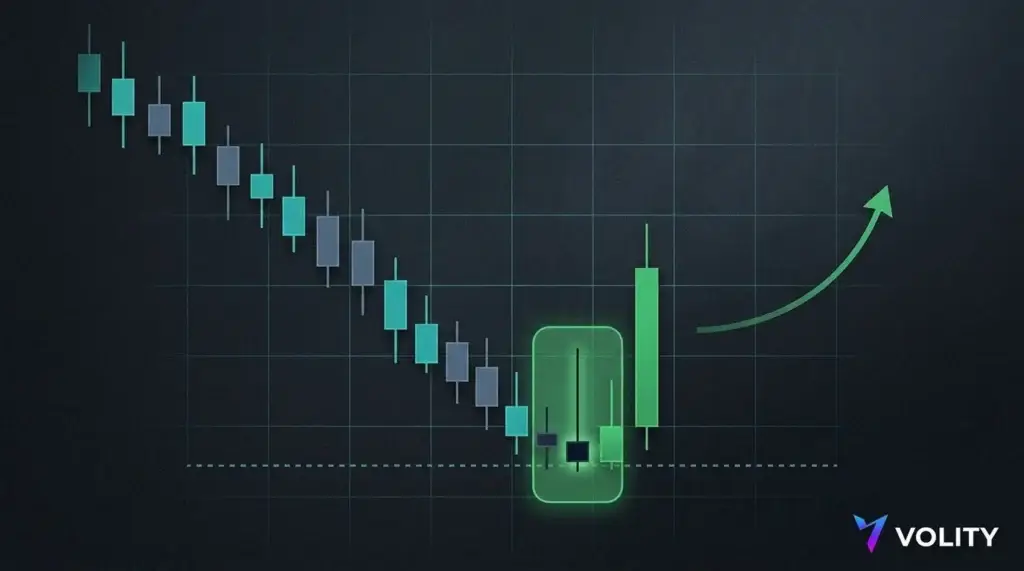
The inverted hammer candlestick meaning is best understood through the fight that produced it. After a sustained decline, buyers step in during the session and drive price sharply higher, which prints the long upper wick. Sellers then push it back down toward the open before the close, leaving the small body near the low. On the surface the sellers won the bar. What matters is that buyers were able to mount a strong rally at all, in a market that had been falling. That is the first crack in the downtrend.
Because the sellers regained control by the close, the signal is not complete. The pattern works as a warning that the decline may be losing momentum, and it earns a trade only once the next candle closes higher than the inverted hammer’s body. That confirmation shows the buying pressure carried through, and it is the difference between a promising shape and a setup you can actually risk money on.
Inverted hammer vs shooting star vs hammer: what is the difference?
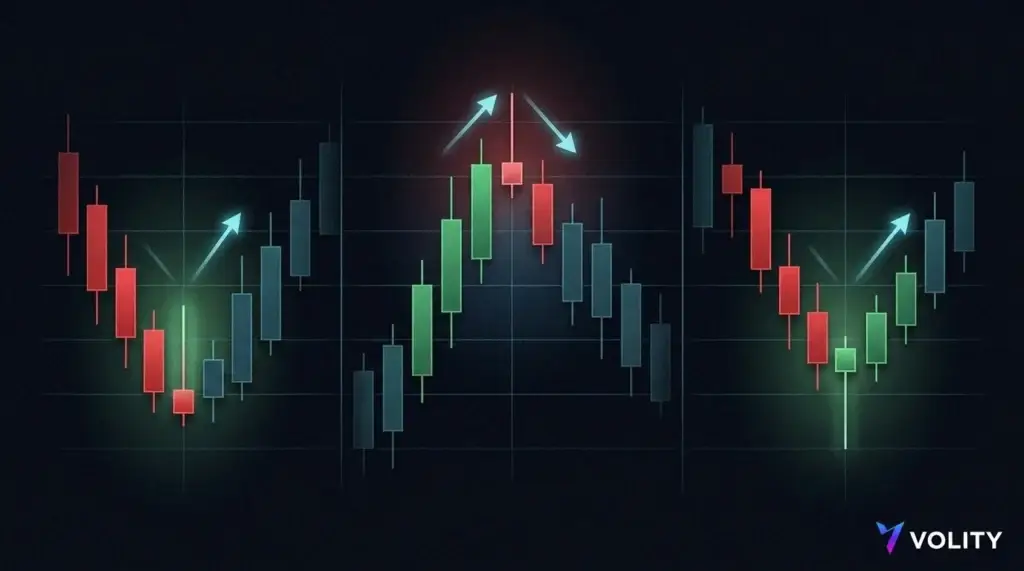
These three candles cause more confusion than any others, because two of them share an identical outline. Location is what tells them apart. This table sets the hammer and inverted hammer against the bearish lookalike, the shooting star.
| Candle | Shape | Where it appears | Signal |
| Inverted hammer | Small body low, long upper wick | Bottom of a downtrend | Bullish reversal (needs confirmation) |
| Shooting star | Small body low, long upper wick (identical) | Top of an uptrend | Bearish reversal |
| Hammer | Small body high, long lower wick | Bottom of a downtrend | Bullish reversal |
Read it this way. The inverted hammer and the shooting star are the same candle in opposite locations, so the identical long-upper-wick shape is bullish at a bottom and bearish at a top. The hammer and inverted hammer are both bullish bottom signals, and the difference is that the hammer carries its long wick below the body rather than above it. Confuse the location and you will trade the wrong direction.
Is a red inverted hammer bearish?
No. A red inverted hammer, one that closes slightly below its open, is not a bearish signal on its own. The colour of the body is a minor detail next to the shape and the location. A green and a red inverted hammer both point to a potential bullish reversal when they form after a downtrend. A green body, where price closes above the open, is marginally more encouraging because it shows buyers held a little more ground, though the gap between the two is small.
The phrase “bearish hammer” usually describes a different candle altogether, either the shooting star at a top or the hanging man, which shares the hammer’s shape but appears after an uptrend. If you are looking at a long upper wick at the bottom of a decline, you are looking at an inverted hammer, whatever colour the body is.
How do you trade an inverted hammer?
A repeatable routine turns the inverted hammer from a chart curiosity into a plan with defined risk.
- Confirm a genuine downtrend into the candle, and ideally a support level, prior swing low, or round number nearby.
- Wait for confirmation instead of acting on the inverted hammer alone. Require the next candle to close above the hammer’s body, or price to break above the hammer’s high.
- Enter as price trades through the high of the inverted hammer, the level that validates the reversal.
- Place a protective stop just below the low of the inverted hammer. A close back under that low invalidates the pattern.
- Aim for the next resistance level or a fixed reward-to-risk multiple, and consider trailing the stop if the move extends.
Two filters raise the odds. Higher volume on the inverted hammer bar suggests real participation behind the rally, and a signal that lines up with an oversold momentum reading or a known support zone is worth more than one floating in open space. Some traders demand a stronger second bar, such as a bullish engulfing candle, before they commit. This kind of confluence is what ordinary candlestick charting education keeps coming back to.
What are the limitations of the inverted hammer?
Single-candle signals are the weakest class of chart pattern, and inverted hammer candlestick patterns are no exception. Without confirmation they fail often, and even confirmed ones can stall if there is heavy resistance overhead. In fast, news-driven markets the shape appears frequently and means little. Most candlestick pattern guides treat it as one signal among many, and treating every inverted hammer as a buy is a quick way to accumulate small losses.
Use the pattern as one input, alongside trend context, support and resistance, and a momentum or volume check drawn from your wider technical analysis. Building the habit of reading candlesticks in context, rather than one bar at a time, is what keeps the pattern useful. On leveraged products such as CFDs, an unconfirmed reversal that fails can move against you quickly, so a stop below the hammer’s low and a fixed risk-per-trade are essential. The pattern gives you a level to work from, and your risk plan gives you the protection.
How can you trade inverted hammer setups on Volity?
Volity is an all-in-one money hub, with your wallet, payments, and trading in one account. The charting in Volity MT lets you mark support levels, spot the inverted hammer across major forex pairs, global indices, commodities, and crypto, and attach a stop-loss and take-profit at the point of entry, so your risk is fixed before the confirmation candle even closes.
Reversal patterns are most useful where you can act quickly in either direction, which is where CFD trading fits. Leverage on major forex pairs reaches up to 1:500 on selected forex pairs, 1:100 on commodities, and 1:50 on crypto, margin shown before every order, and negative balance protection in place. Charts run on the Volity platform, and the trading layer is regulated by CySEC under UBK Markets, licence 186/12. See the published charges and fees for the full cost picture.
CFDs are leveraged products, and most retail accounts lose money trading them, which is why regulators such as the FCA and ESMA cap retail leverage and restrict how these products are sold. An inverted hammer helps you define your risk on a trade. It does not remove it. The CySEC investor-protection rules that govern the account exist for exactly that reason.
Related patterns
Frequently asked questions
Is an inverted hammer bullish or bearish?
An inverted hammer is a bullish reversal signal when it forms at the bottom of a downtrend and is confirmed by a higher close on the next candle. The same shape at the top of an uptrend is a shooting star, which is bearish. The location of the candle sets the direction, because the outline on its own is identical to that bearish shooting star.
How reliable is the candlestick pattern inverted hammer?
On its own it is only moderately reliable, because single-candle patterns fail often. Reliability improves markedly when the inverted hammer appears at a support level, is backed by higher volume, and is confirmed by the following candle. Traders who wait for that confirmation, rather than buying the hammer itself, tend to get far better results.
What is the difference between a hammer and inverted hammer?
Both are bullish reversal candles that appear at the bottom of a downtrend, and both have a small body with one long wick. The difference is which side the wick sits on. A hammer has a long lower wick below the body, while an inverted hammer has a long upper wick above it. Both need confirmation before you act.
Does the colour of the inverted hammer matter?
Only slightly. A green inverted hammer, closing above its open, is marginally stronger than a red one because it shows buyers held more ground. Both colours still signal a potential bullish reversal at the bottom of a downtrend. Shape and location matter far more than the colour of the body.