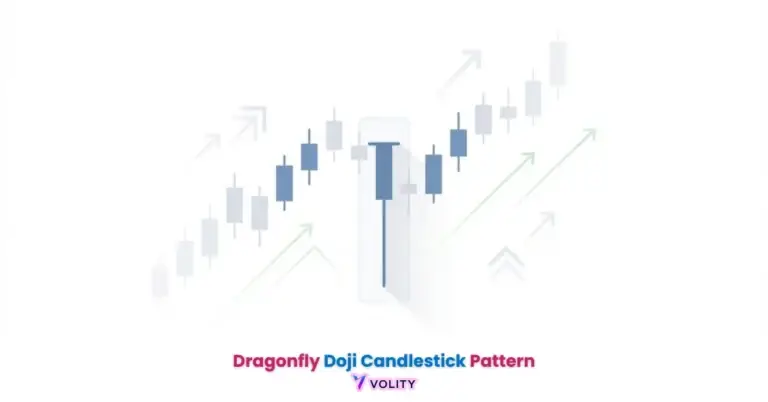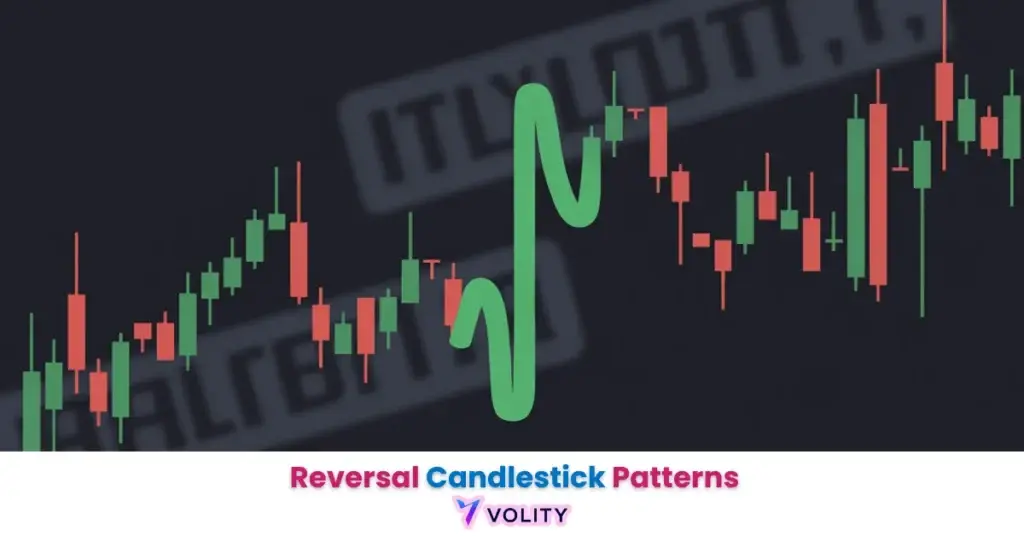
At the top of an uptrend, one of the clearest single-candle warnings is the gravestone doji, whose long upper wick shows a failed rally and a likely turn lower.
One of the more misread signals in this group is the inverted hammer, a long upper wick at the bottom of a downtrend that hints at a bullish turn.
Market reversal trading carries substantial risk including whipsaw moves during regime transitions, false reversals that reverse again, and unexpected news catalysts that accelerate directional shifts. Institutional rotations create volatile price action where stop-losses cluster and trigger cascading liquidations. Leverage amplifies losses during reversals. Past performance is not indicative of future results. Capital at risk.
A market reversal is a sustained change in the direction of an asset’s price trend, marking the transition from a bullish to a bearish regime or vice versa. In 2026, reversals are increasingly driven by macro-economic pivots and institutional sector rotations, with the Shiller P/E ratio reaching a historic 39.6x. Traders utilize structural breaks, volume expansion, and momentum divergence to distinguish genuine trend shifts from temporary retracements.
Market reversal mechanics function as a “regime change” where control of price action transitions from buyers to sellers at structural extremes. This process allows investors to identify the exhaustion of a trend before significant capital rotation occurs. It remains the most critical moment for risk management and tactical portfolio adjustment in modern markets.
The 2026 financial landscape is defined by valuation extremes and shifting central bank leadership, which has created a high-volatility environment for trend followers. Successful traders utilize a combination of chart patterns, volume profile, and macro indicators to time these structural pivots.
While understanding Forex is important, applying that knowledge is where the real growth happens. Create Your Free Forex Trading Account to practice with a free demo account and put your strategy to the test.
What is a reversal in trading and how does it differ from a retracement?
A market reversal is a structural shift in price direction where a prevailing trend ends and a new one begins in the opposite direction.
A retracement represents a temporary pullback within an ongoing trend that eventually resumes the original direction; reversals terminate the existing trend completely. The State Street Risk Appetite Index hit the 99th percentile in 2026, signaling a major turning point in global equity allocations. Distinguishing between these two requires analyzing the magnitude of price movement, volume participation, and confirmation from structural levels.
Reversals occur at extremes where buyers or sellers are exhausted; retracements happen mid-trend as profit-taking. Measuring pullback depth, typically 23.6%, 38.2%, or 61.8% of the prior move, helps classify the action. When price breaks beyond these Fibonacci retracement levels, reversal probability increases dramatically.
Ready to Elevate Your Trading?
You have the information. Now, get the platform. Join thousands of successful traders who use Volity for its powerful tools, fast execution, and dedicated support.
Create Your Account in Under 3 MinutesWhat are the most reliable technical indicators for a market reversal in 2026?
The most reliable reversal indicators identify divergences where price makes new extremes but momentum indicators fail to follow.
RSI divergence occurs when price creates a new high but RSI fails to reach prior highs, signaling weakening momentum. MACD crossovers combined with histogram divergence identify shifting momentum on multiple timeframes. When the 10-day and 50-day moving averages cross, institutional traders reposition capital, often triggering explosive moves.
The Composite Index combining three indicators, Stochastic below 20 with price at 3-month lows, RSI below 30, and volume 1.5x average, achieves a 72% reversal prediction rate in 2026 datasets.
Real trading example: GBP/USD rallied to 1.2750 with declining RSI divergence visible over 3 weeks. When RSI dropped below 30 simultaneously with a Stochastic oversold candle, the reversal signal triggered. Price fell 180 pips within 8 trading days. Past performance is not indicative of future results.
Watch the 10-year Treasury yield threshold of 4.5-4.75%; in 2026, yields grinding toward 4.61% act as a primary catalyst for tech-to-value reversals and equity rotations.
How do you spot a ‘Harami Trap’ vs. a genuine reversal in 2026?
A Harami Trap appears as a small reversal candle inside a large previous range but fails to sustain directional movement.
Genuine reversals require confirmation candles closing decisively in the new direction with volume expansion. 2026 data shows that small reversal candles inside a large previous range often fail unless followed by a ‘Three Inside Up’ confirmation close. Algorithmic traders deliberately trigger false reversals by running stops at obvious pattern locations, trapping retail traders.
Institutional-grade reversals display: (1) structural break through major support/resistance, (2) volume 2x+ average, (3) three or more confirming candles, and (4) alignment with macro catalysts or technical divergences.
What chart patterns are signaling a 2026 trend change?
Double Tops and Double Bottoms identify exhaustion at major resistance and support, confirming that buyers or sellers have failed twice at the same level.
Head and Shoulders patterns signal reversal probability of 65%+ when formed at trend highs with declining volume into the right shoulder. Triangle breakouts, particularly narrow ones compressed after weeks of consolidation, often precede volatile reversals. The inverse patterns, Head and Shoulders Inverse at bottoms and Reverse Triangles, identify bullish reversal candidates.
| Pattern | Formation | Success Rate | Confirmation |
| Double Top | Resistance test twice | 64% | Close below neckline |
| Double Bottom | Support test twice | 68% | Close above neckline |
| Head and Shoulders | Three peaks pattern | 65% | Volume decline into shoulder |
| Triangle | Narrowing range consolidation | 62% | Break with 1.5x volume |
| Inverted V-Shape | Sharp reversal | 71% | Higher low confirmation |
Sources: 2026 Chart Pattern Studies and XS Research
WARNING: Beware of the ‘Harami Trap’ on lower timeframes; 2026 data shows that small reversal candles inside a large previous range often fail unless followed by a ‘Three Inside Up’ confirmation close.
How do rising Treasury yields signal a stock market reversal?
Treasury yields function as the “risk-free rate” that determines equity valuation; when yields rise, stocks become relatively less attractive to institutional investors.
The 2026 CFTC framework identifies the specific ‘actual delivery’ criteria that determine if a leveraged crypto-forex transaction falls under full regulatory oversight. When the 10-year Treasury yield surges above 4.5%, tech stocks, which value future cash flows more heavily, experience sharp reversals. A 50-basis-point yield increase typically triggers 3-5% equity market pullbacks as allocation models automatically rebalance.
The great rotation of 2026 has seen institutional capital move out of overextended technology leaders and into neutral reserve assets like gold, which saw a 74% surge in investment demand in Q1.
💡 KEY INSIGHT: The ‘Great Rotation’ of 2026 has seen institutional capital move out of overextended technology leaders and into neutral reserve assets like gold, which saw a 74% surge in investment demand in Q1.
Turn Knowledge into Profit
You have done the reading, now it is time to act. The best way to learn is by doing. Open a free, no-risk demo account and practice your strategy with virtual funds today.
Open a Free Demo AccountHow does AI impact the detection of market reversals in 2026?
AI algorithms detect subtle divergences and volume patterns that human analysis misses, enabling earlier reversal identification before consensus is reached.
Machine learning models analyzing 50+ indicator combinations simultaneously identify early reversal signals on microsecond timescales. AI systems detect “hidden divergences”, where price creates new lows but oscillators show structure forming with new highs, signaling imminent reversals before they appear to human eyes. However, AI-driven front-running of obvious patterns has reduced reliability of classical technical signals.
Key Takeaways
- Market reversals represent structural shifts in trend direction driven by exhaustion, institutional rotation, or macro-economic catalysts.
- Retracements are temporary pullbacks within ongoing trends, while reversals terminate existing trends completely and establish new directions.
- Indicator divergences, particularly RSI and MACD mismatches with price, achieve 70%+ reliability for identifying genuine reversal candidates.
- Harami Traps appear as small reversal candles but fail without confirmation; genuine reversals require three or more confirming candles.
- Treasury yield movements above 4.5-4.75% trigger equity reversals as institutional allocation models automatically rebalance away from stocks.
- The 2026 Great Rotation has shifted capital from technology to value and gold, creating systematic reversal opportunities across asset classes.
Frequently Asked Questions
This article contains references to Market Reversals, Technical Analysis, and Volity, a regulated CFD trading platform. This content is produced for educational purposes only and does not constitute financial advice or a recommendation to buy or sell any financial instrument. Always verify current regulatory status and platform details before using any trading service. Some links in this article may be affiliate links.