Choosing between chart types does not eliminate the risk of trading losses. Line charts can hide critical “wick rejection” signals that candlestick charts reveal, leading to false trend identification. Bar charts require precise manual interpretation of ticks, creating opportunities for misreading market structure. Leverage amplifies losses on every trade regardless of chart format. Past performance is not indicative of future results. Capital at risk.
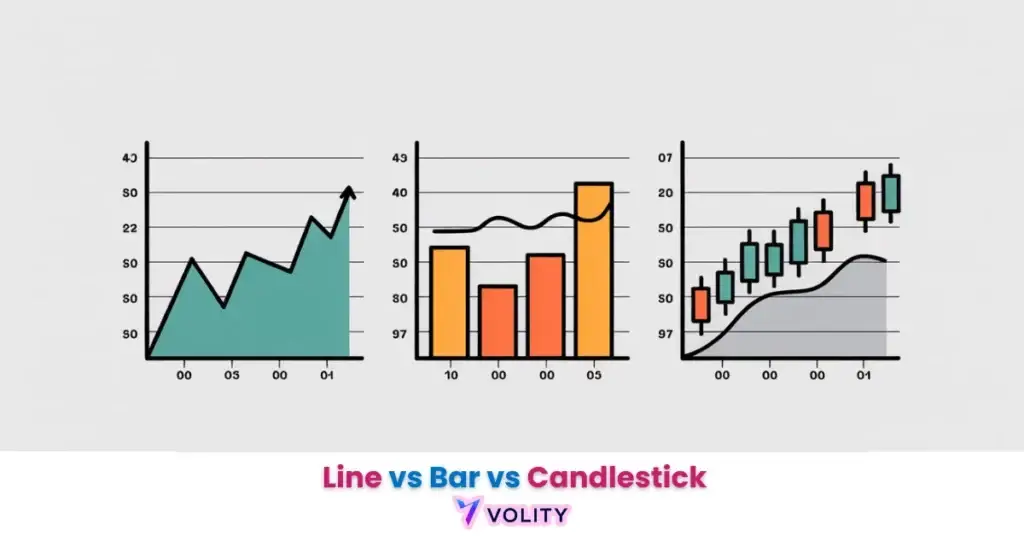
The choice between line, bar, and candlestick charts determines the depth of price data visible to a trader. Line charts provide a simplified view of closing prices, ideal for long-term trend identification. Bar charts (OHLC) offer more granular data but lack visual cues, while candlestick charts utilize color-coded bodies to reveal market psychology and momentum. In 2026, selecting the appropriate chart type is the first step toward building a consistent technical analysis framework.
Line, bar, and candlestick charts identify different levels of price detail encoded within the same market data. This comparative framework allows participants to choose a visual style that matches their specific trading horizon and strategy. It serves as the primary gateway for interpreting supply and demand dynamics in the global forex market.
The 2026 trading environment requires a seamless transition between various charting formats to confirm structural shifts and identify “Noise.” Mastering the differences between these three types enables participants to maintain a balanced perspective on market volatility. Candlesticks are the default interface on most retail platforms, which is why the other two formats are usually reached for deliberately rather than by habit.
While understanding Forex is important, applying that knowledge is where the real growth happens. Create Your Free Forex Trading Account to practice with a free demo account and put your strategy to the test.
What are the three primary types of forex charts?
Forex charts are graphical representations of currency price movements that identify historical trends using line, bar, or candlestick formats. All three formats utilize the same underlying market data but display it in different visual structures. This standardization enables traders to switch between formats without losing analytical continuity.
Every chart encodes four core data points:
- Open Price represents the first transaction price of the trading session.
- High Price reveals the maximum price level reached during the period.
- Low Price shows the minimum price touched before the close.
- Close Price displays the final transaction price as the session ends.
Effectively every trading platform ships all three chart types as standard, so traders can compare formats side by side and identify which visual style best matches their analytical preferences. The open-high-low-close chart and the candlestick chart references set out the structural definition of each format and how the same four price points are drawn differently in each.
The OHLC Framework: The DNA of Charting
The OHLC framework identifies the four critical price levels reached during a specific trading session, serving as the raw input for bars and candles. This standardized framework allows institutional and retail traders to compare identical price action across different visual formats. Understanding OHLC structure unlocks the ability to read all three chart types with equal proficiency.
Each OHLC data point serves a distinct analytical purpose. The open represents the shift in overnight sentiment, a gap up indicates bullish overnight positioning, while a gap down reveals bearish accumulation. The high-low range demonstrates volatility and institutional order placement. The close reveals which side “won” the session, prices closing near the high favor bulls, while closes near the low favor bears.
Ready to Elevate Your Trading?
You have the information. Now, get the platform. Join thousands of successful traders who use Volity for its powerful tools, fast execution, and dedicated support.
Create Your Account in Under 3 MinutesLine Charts: Simplicity and the Big Picture
Line charts identify the primary market trend by connecting a series of closing prices with a continuous visual line. This minimalist approach filters out all intra-session volatility and focuses exclusively on the final transaction price of each period. Professional macro-analysts prefer line charts when comparing long-term multi-year trends.
Line chart strengths include total clarity, without color, body size, or wick noise, the visual signal of trend direction becomes unmistakable. A rising line unambiguously reveals uptrend strength; a falling line reveals downtrend momentum. This simplicity makes line charts ideal for identifying major support/resistance zones that will determine multi-month trend reversal points. Market Structures explains how to use line charts for structural analysis on long-term timeframes.
Line chart weaknesses emerge immediately when intraday traders require volatility data. The line chart hides the “wick rejections” that signal buyer or seller exhaustion. It reveals no information about the high-low range, masking the volatility spikes that trigger stop-loss orders. A line chart cannot distinguish between a session that closed at the high (strong conviction) and a session that closed at the low (weak conviction), both appear as identical dots on the line.
Professional “Naked” traders in 2026 often use line charts for strategic planning. They identify major support and resistance on the line chart, then switch to candlesticks for precise entry timing at those levels. This hybrid approach combines the clarity of lines with the precision of candles.
Bar Charts (OHLC): Technical Precision without the Color
Bar charts identify the full range of price action for a period by displaying vertical lines for highs and lows with horizontal ticks for the open and close. This format displays four critical data points but without the visual weight of colored bodies. Technical analysts prize bar charts for trendline drawing and precise support/resistance placement.
Bar chart anatomy shows the vertical line representing the high-low range, with the left tick marking the open and the right tick marking the close. A tall bar indicates high volatility; a short bar reveals price consolidation. A bar with the close above the open indicates bullish sentiment; a bar with the close below the open indicates bearish sentiment. However, bar charts require manual interpretation, readers must consciously compare each tick position rather than relying on visual color cues.
Bar chart strengths include reduced visual clutter compared to candlesticks, the absence of bodies allows trendlines to be drawn with greater precision through open or close levels. Professional technical analysts prefer bars for drawing diagonal support/resistance because the thin visual format allows exact placement without obscuring trendline angles. Institutional traders use bar charts to analyze institutional order flow because tick positions reveal where large orders entered.
Bar chart weaknesses emerge for beginners, reading sentiment requires manual comparison of tick positions. Many traders find the color-coded logic of candlesticks more intuitive than trying to interpret bar anatomy. Additionally, bars provide no information about market psychology at a glance; identifying exhaustion or reversal requires trained pattern recognition.
Real trading example: A trader used a bar chart on the USD/JPY Daily timeframe to draw a precise descending trendline that bypassed the “wick noise” of a candlestick chart. The trendline held for 4 consecutive touches, allowing for a high-probability breakout trade at 145.00. Past performance is not indicative of future results.
Candlestick Charts: The Gold Standard of Market Psychology
Candlestick charts identify market sentiment through color-coded bodies that represent the distance between the open and closing prices. This format remains the industry standard because it communicates psychological signals faster than bar or line charts. The colored body reveals sentiment instantly, green candles signal bullish conviction, red candles signal bearish dominance.
| Chart Type | Key Feature | Visibility Level | Best Strategy |
| Line | Close Only | Low Detail | Trend ID |
| Bar | OHLC Ticks | Medium Detail | Precision S/R |
| Candlestick | Colored Body | High Detail | Price Action |
| Heikin Ashi | Average Price | Momentum Filter | Trend Following |
| Renko | Fixed Brick | Time-Independent | Breakout Only |
Candlestick strengths dominate for active traders. The color-coded body creates instant visual recognition, green means up, red means down. Large bodies signal strong conviction; small bodies signal indecision. Upper wicks reveal buyer rejection at higher prices; lower wicks reveal seller rejection at lower prices. This multi-layered information allows traders to identify reversal patterns, exhaustion signals, and momentum shifts within seconds of a candle close.
Candlestick weaknesses emerge only when excessive candle body size obscures precise trendlines or support/resistance placement. Professional traders overcome this by overlaying a bar chart on top of the candlestick format for drawing trendlines while maintaining candlestick sentiment analysis. Japanese Candlestick Patterns explains the historical context and pattern-recognition frameworks that make candlesticks so powerful.
Candlesticks have dominated retail trading since their introduction to Western markets in the 1990s. The Japanese rice traders who invented candlestick charting in the 1700s understood that visual pattern recognition drives faster decision-making than numerical analysis, candlesticks remain the standard because they outperform other formats for price action trading.
Comparison: Which chart type is best for you?
Optimal chart selection identifies the best visual interface based on a trader’s specific timeframe and technical complexity requirements. Each chart type serves distinct trading horizons and strategic goals. Matching chart type to trading style is as critical as matching position size to risk tolerance.
Beginners benefit most from candlestick charts because color-coded logic requires minimal manual interpretation. The beginner can focus on pattern recognition rather than tick analysis. A green candle with a large body and small lower wick requires less conscious thought to identify than a bar chart equivalent, the visual communication is faster and more intuitive.
Scalpers trading 5-minute charts demand maximum information density, making candlesticks mandatory. The high-frequency trader requires instant recognition of momentum shifts, rejection signals, and exhaustion patterns. Line charts would obscure all critical signals; bar charts would slow decision-making through manual tick interpretation.
Position traders holding positions for weeks or months benefit most from line charts. The long-term trader’s primary goal is identifying major support/resistance zones that will dominate multi-week price action. Line charts simplify this analysis by removing all intraday noise. Attempting to read 4-hour candlestick patterns when holding a 3-week position creates analysis paralysis, the trader becomes lost in detail when structure is what matters.
Switching between chart types during live trades creates a serious psychological risk. Professional traders maintain one primary chart format throughout a trading session to avoid “Confirmation Bias”, the tendency to search for a chart that shows what you want to see rather than what the market actually shows. How to Read Candlesticks explains why candlesticks reveal patterns that other formats obscure.
Turn Knowledge into Profit
You have done the reading, now it is time to act. The best way to learn is by doing. Open a free, no-risk demo account and practice your strategy with virtual funds today.
Open a Free Demo AccountAdvanced Charting: Customizing your 2026 Interface
Interface optimization identifies the personal settings required to balance information density with visual clarity on professional platforms. Modern 2026 trading platforms allow granular customization of chart appearance, helping traders overcome their personal visual preferences and biases.
Custom color schemes transform the impact of candlestick analysis. Dark mode reduces eye fatigue during extended trading sessions and makes white/hollow candles (bullish) stand out more prominently against the background. Light mode makes red/solid candles (bearish) appear more psychologically threatening, some traders intentionally use this to maintain emotional discipline and prevent overconfidence.
Overlaying line charts on candle charts creates a hybrid interface that combines the clarity of lines with the insight of candles. Drawing the daily close line directly on the hourly candlestick chart enables traders to see when hourly candles form above or below the daily trend, a powerful confirmation signal.
Professional traders customize grid sizes, timeframe colors, and indicator visibility based on their specific style. A scalper might disable the grid entirely to see price action clearly, while a structural trader might enable grid lines every 50 pips to identify psychological support/resistance zones. Forex Charts explains advanced platform features for chart customization.
Key Takeaways
- Price charts are essential visual tools that encode market data into line, bar, or candlestick formats.
- Line charts connect closing prices to provide a clean, noise-free view of long-term trend direction.
- Bar charts display the full open-high-low-close data without the visual clutter of colored bodies.
- Candlestick charts use color-coded bodies to communicate buyer-seller sentiment and market psychology at a glance.
- OHLC data is the foundational input for all technical charts, representing the price extremes of a trading session.
- Strategic selection of your chart type should align with your trading style, from long-term trends to high-frequency scalping.
Frequently Asked Questions
This article contains references to chart types, technical analysis, and Volity, a regulated CFD trading platform. This content is produced for educational purposes only and does not constitute financial advice or a recommendation to buy or sell any financial instrument. Chart selection does not guarantee profitable outcomes; false patterns can appear on all chart types during volatile market conditions. Always verify patterns across multiple timeframes before committing capital. Some links in this article may be affiliate links.