When one of these fair value gaps fails and price closes back through it, the zone flips into an inverse fair value gap, a continuation signal you can trade in the new direction.
One ICT concept worth learning early is the rejection block, a zone drawn from the long wicks left when price is slammed back from a swing high or low.
Inner Circle Trader (ICT) analysis carries substantial risk due to subjective pattern interpretation. Fair Value Gap identification and Order Block placement vary between traders, creating entry signal ambiguity. Liquidity sweeps can exceed planned stop losses during high-impact economic events. Algorithmic market conditions in 2026 create rapid reversals that may not follow historical ICT patterns. Past performance is not indicative of future results. Capital at risk.
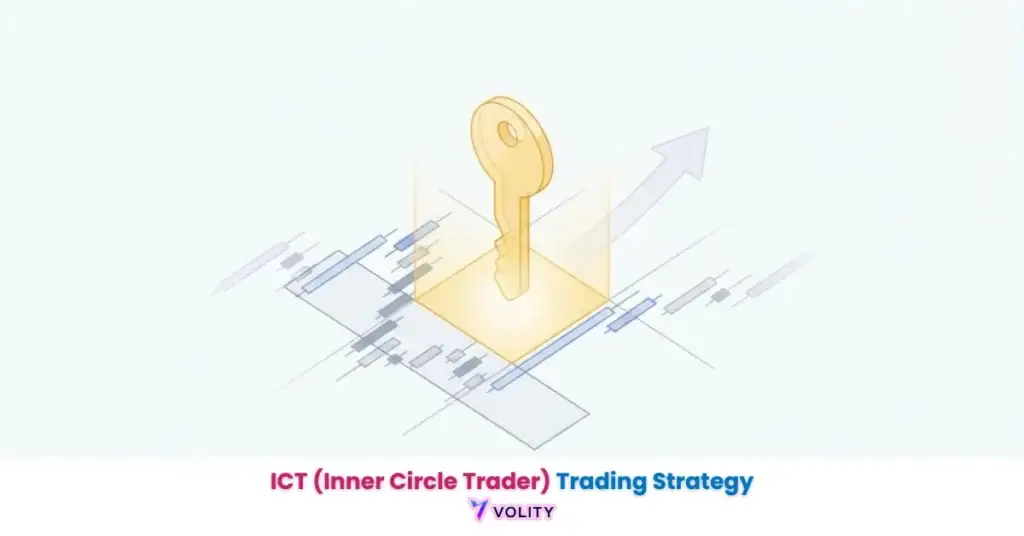
The Inner Circle Trader (ICT) methodology identifies market inefficiencies and institutional liquidity pools to predict future price direction. This framework operates on the premise that markets are algorithmically delivered rather than driven by retail sentiment. It overlaps heavily with what the wider market calls Smart Money Concepts (SMC), and the two vocabularies are often used interchangeably.
ICT trading identifies the “Smart Money” footprints that remain invisible to traditional technical indicators. This approach prioritizes the study of price delivery algorithms (IPDA) and the specific time-of-day windows when institutional volatility peaks. It provides a comprehensive roadmap for navigating the complexities of the modern interbank market.
The 2026 financial landscape features increased algorithmic competition, making the identification of “trapped” retail liquidity more critical than ever. Mastering ICT concepts enables participants to trade alongside central banks and major financial institutions rather than against them.
While understanding Inner Circle Trader (ICT) is important, applying that knowledge is where the real growth happens. Create Your Free Forex Trading Account to practice with a free demo account and put your strategy to the test.
What is ICT trading and how does it differ from retail analysis?
ICT trading is a price action methodology that identifies institutional intent by analyzing how the Interbank Price Delivery Algorithm (IPDA) seeks liquidity. The approach originates from Michael J. Huddleston’s price action framework and rejects traditional retail indicators like RSI and MACD. Instead, ICT traders focus on pure price structure and the specific times when institutions deliver price to targeted liquidity pools.
ICT emphasizes why price moves, not just when. Retail analysis treats markets as randomly fluctuating supply-and-demand curves. Institutional traders understand that price is delivered algorithmically to sweep liquidity before reversing. This distinction transforms how traders interpret every candle and every session opening.
The framework categorizes market behavior into three groups:
- Origins: Michael J. Huddleston developed ICT from decades of market maker and forex bank experience.
- Indicator rejection: RSI, MACD, and moving averages create lag that causes traders to enter trades after the institutional move is already complete.
- Algorithmic delivery: Price reaches specific targets on predetermined schedules, not random walks.
Within the framework, IPDA is described as recalibrating price efficiency over 20, 40 and 60-day lookback periods. Those windows are part of the teaching rather than a measured market property.
The IPDA: Understanding the Market Brain
The Interbank Price Delivery Algorithm represents the theoretical software used by major banks to maintain liquid and efficient markets. This system determines when price sweeps highs, lows, and overnight gaps to collect trapped retail stop losses. The IPDA then reverses toward the session’s profit target.
Price movement follows four distinct phases: Consolidation (accumulation), Expansion (volatility increases), Retracement (pullback to gather more liquidity), and Reversal (final move toward target). Understanding these phases prevents traders from fighting algorithmic price delivery. Time and price represent the only two variables that matter in this framework, all else follows from these two dimensions.
Core ICT Concepts: FVGs, Order Blocks, and Liquidity
Institutional footprints identify market imbalances through specific formations like Fair Value Gaps and high-volume Order Blocks. These formations reveal where institutions have positioned capital and where they plan to accumulate or distribute more liquidity. Understanding these structures separates retail observation from professional analysis.
Three core concepts define ICT analysis:
- Fair Value Gaps (FVG): Price moves so aggressively in one direction that a candle gap forms, leaving an inefficiency institutions eventually revisit and “fill.”
- Order Blocks (OB): The final candle before a major institutional impulse move, showing where smart money accumulated before the directional breakout.
- Liquidity Pools: Buy-Side Liquidity (BSL) represents retail stop losses above resistance; Sell-Side Liquidity (SSL) represents stops below support that institutions hunt to fuel reversals.
Liquidity sweeps are intentional in this reading of the market. Resting stop orders above an old high are themselves liquidity, and a large order needs a counterparty to fill against. The behaviour described is the same across forex, stocks and futures. Most retail traders interpret these sweeps as trend continuations and get stopped out before the actual reversal.
Identifying Liquidity in Forex Trading reveals why major reversals happen exactly where institutions need liquidity. Order Block identification shows where smart money enters with conviction. Together, these concepts form the operational foundation of ICT analysis.
Ready to Elevate Your Trading?
You have the information. Now, get the platform. Join thousands of successful traders who use Volity for its powerful tools, fast execution, and dedicated support.
Create Your Account in Under 3 MinutesThe ICT Silver Bullet Strategy: 2026 Execution Rules
The Silver Bullet strategy identifies a high-probability time-based window where institutional algorithms reprice assets toward a specific liquidity target. This approach combines time filters with price structure to maximize setup reliability. Entry timing and the daily session window determine whether a trade succeeds or fails.
Three time windows dominate institutional price delivery. The London kill zone (3-4 AM EST) marks the European open when London traders position for the day. The New York kill zone (10-11 AM EST) occurs when institutional capital from multiple continents converges. The New York close (2-3 PM EST) produces forced liquidations and position adjustments. Each window offers distinct supply-and-demand imbalances.
Entry criteria require three aligned signals:
- Market Structure Shift (MSS): Price breaks a significant swing high or low on the Daily/Weekly timeframe.
- Fair Value Gap (FVG): A fresh three-candle imbalance forms on the 5-minute chart within the time window.
- Reversal Zone: The entry targets the nearest “External Liquidity”, the previous session high or low that institutions use as profit-taking targets.
Real trading example: NASDAQ (NQ) Futures exhibited a textbook Silver Bullet setup. At 10:15 AM EST, NQ swept the London High, followed by a Market Structure Shift on the daily chart and a 5-minute FVG entry at 19,250. Price reached the Daily Low target within 45 minutes, yielding a 4:1 reward-to-risk ratio on a 150-pip move. Past performance is not indicative of future results.
Support and Resistance Trading explains how to identify these external liquidity targets across multiple timeframes. Professional traders spend weeks backtesting kill zone entries in historical data before risking real capital. The Silver Bullet’s success depends entirely on consistency with time window selection and strict adherence to entry and exit criteria.
ICT vs. SMC (Smart Money Concepts): What’s the difference?
Terminology differentiation identifies the relationship between the original ICT teachings and the broader Smart Money Concepts used by the trading community. The two frameworks overlap significantly but carry important distinctions in origin and scope.
| Concept | ICT Terminology | SMC/Retail Equivalent | Institutional Meaning |
| FVG | Fair Value Gap | Imbalance / Void | Inefficient Delivery |
| OB | Order Block | Supply/Demand Zone | Institutional Entry |
| MSS | Market Structure Shift | Break of Structure (BOS) | Trend Change |
| BSL | Buy-Side Liquidity | Resistance / Stops | Counterparty Orders |
| PO3 | Power of Three | AMD Model | Accum/Manip/Dist |
ICT represents the original framework developed by Michael J. Huddleston from his experience as a forex bank trader and market maker. Smart Money Concepts (SMC) emerged as a broader, more accessible interpretation of these principles for retail audiences. SMC simplifies ICT terminology but sacrifices precision. Both sit inside the broader discipline of order flow trading, which reads the order book and footprint charts directly rather than inferring intent from a named pattern.
Both frameworks share the core belief that price delivery is algorithmic. ICT emphasizes time-based kill zones and specific session windows. SMC focuses more broadly on general liquidity hunting and trend-following principles. Traders mixing both approaches often succeed because the underlying mechanics remain identical, institutions sweep liquidity before reversing to profit targets.
The Power of Three (AMD): Accumulation, Manipulation, Distribution
The Power of Three identifies the typical daily cycle of price action by tracking how liquidity is gathered before a directional move. This three-phase cycle repeats across all timeframes and all liquid markets. Understanding where price sits in this cycle improves entry timing and profit target selection.
Accumulation represents the tight ranging phase where institutions quietly build positions without pushing prices higher. This phase appears quiet and boring on charts, exactly as intended to avoid alerting retail traders. Manipulation (The Judas Swing) follows, where institutions execute a violent sweep through recent support or resistance to trigger retail stop-loss orders. This creates liquidity for the final phase. Distribution arrives when the true directional move begins, launching toward the daily profit target.
The three phases operate on mechanical timelines. Accumulation typically lasts 30-60 minutes after the session open. Manipulation occurs within 1-3 minutes of extreme speed and volume. Distribution extends for 1-4 hours toward the target. Trading during Accumulation generates losses because prices haven’t committe to direction. Patient traders wait for the Judas Swing completion to see clear directional structure before entering.
Modern 2026 trading scripts can now automatically highlight “Judas Swings” by detecting rapid volume expansion against the opening range. Automation accelerates pattern recognition but cannot replace manual price structure analysis. The best traders combine algorithmic alerts with visual confirmation of the three-phase cycle before committing capital.
Turn Knowledge into Profit
You have done the reading, now it is time to act. The best way to learn is by doing. Open a free, no-risk demo account and practice your strategy with virtual funds today.
Open a Free Demo AccountIs ICT Trading Profitable for Beginners in 2026?
Mastery identification identifies the steep learning curve and psychological discipline required to successfully implement ICT concepts in live markets. ICT trading demands more preparation than traditional technical analysis but generates higher accuracy for traders willing to invest the effort.
The primary obstacle is terminology overload. Fair Value Gap, Order Block, Liquidity Sweep, Market Structure Shift, Kill Zone, Judas Swing, Power of Three, Accumulation, and a dozen other terms create analysis paralysis. Most beginner ICT traders spend their first 6-12 months confused by competing definitions and subjective pattern identification. This confusion causes premature account depletion before genuine skill emerges.
The 2026 standard for ICT beginners involves 6-12 months of backtesting on demo accounts before risking real capital. This preparation period builds muscle memory for recognizing FVGs and Order Blocks under all market conditions. Traders who skip this period and move straight to live markets are paying tuition to the market instead of to a demo account.
Successful ICT traders combine three elements. Risk Management establishes position sizing that survives inevitable losses. Practical experience teaches how to distinguish genuine institutional moves from false breakouts. Consistent backtesting on one pair and one timeframe builds the decision-making speed required for kill zone trading.
Key Takeaways
- The ICT methodology focuses on tracking institutional price delivery rather than relying on lagging technical indicators.
- Fair Value Gaps represent market imbalances where price moves too quickly, leaving an inefficiency that is often revisited.
- Order Blocks identify the specific zones where large institutional players have accumulated or distributed significant positions.
- The Silver Bullet strategy utilizes specific time-based windows during the London and New York sessions for high-probability setups.
- Liquidity sweeps are intentional price movements designed to trigger retail stop-loss orders to fuel institutional reversals.
- Market Structure Shifts provide the primary signal that institutional intent has changed and a new trend leg is beginning.
Frequently Asked Questions
This article contains references to Inner Circle Trader (ICT) methodology and Volity, a regulated CFD trading platform. This content is produced for educational purposes only and does not constitute financial advice or a recommendation to buy or sell any financial instrument. ICT pattern recognition is subjective and backtesting results may not predict live trading performance. Always test ICT strategies extensively on demo accounts before committing real capital. Some links in this article may be affiliate links.