The harami candlestick pattern is a reversal signal, not a guarantee. A harami can trigger false reversals in strong trending markets where buyers or sellers simply pause briefly before resuming the original trend. Algorithmic “liquidity hunts” often spike through the mother candle’s high or low to trigger stops before reversing, creating temporary whipsaws. Leverage amplifies losses when harami-based trades are stopped out during volatile sessions or unexpected news events that override technical patterns. Capital at risk in all leveraged trading.
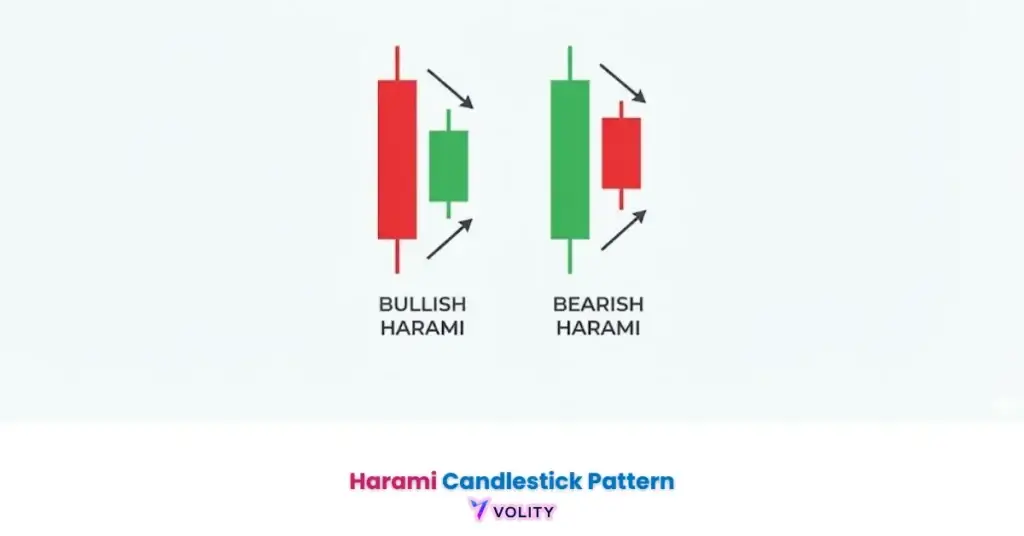
The harami candlestick is a two-candle reversal formation where a small second candle (the “baby”) is completely contained within the real body of a large first candle (the “mother”). It signals that the prevailing trend is losing momentum and entering a period of indecision. It is a pause, not a turn. Thomas Bulkowski’s tests found the bullish harami acts as a bullish reversal only 53% of the time and the bearish harami acts as a bullish continuation 53% of the time, which is close enough to random that the confirming breakout, not the harami, is the signal.
Harami candlestick patterns function as a visual representation of market deceleration, organizing shifting momentum into a recognizable structural containment. This pattern identifies the moment when a dominant trend pauses to consolidate, as buyers and sellers reach a temporary equilibrium within a narrow range. It serves as a primary signal for traders seeking to identify trend exhaustion before a new directional move begins.
The 2026 trading landscape is characterized by high-frequency “range-traps” that often mimic the harami structure during minor corrections. By utilizing volume filters and higher-timeframe confirmation, market participants can distinguish between a simple trend breather and a definitive structural reversal in currency and stock pairs.
While understanding Harami Candlestick Pattern is important, applying that knowledge is where the real growth happens. Create Your Free Forex Trading Account to practice with a free demo account and put your strategy to the test.
What is a harami candlestick pattern and how do you identify it?
A harami is a two-candle reversal pattern that identifies a potential shift in market sentiment by enclosing a small “baby” candle within the real body of a larger “mother” candle.
The pattern’s name derives from the Japanese word “harami,” meaning “pregnant.” The visual structure perfectly mirrors this concept, the smaller candle sits within the larger candle’s body, appearing contained and enclosed. This pregnancy metaphor highlights how the market has absorbed external pressure, temporarily quieting the dominant trend’s momentum.
The structural rules for a valid harami are non-negotiable. The second candle’s open and close prices (the body) must sit entirely within the first candle’s body. The wicks can extend beyond the mother candle’s range, but the critical element is body containment. This containment signals that neither buyers nor sellers could push prices beyond the range established by the large mother candle, classic indecision.
Trend context determines whether a harami signals a reversal. A harami appearing at the end of a 5-bar uptrend signals potential weakness. The same pattern appearing in the middle of a sustained rally often represents just a pause, not a top. Professional traders require at least 3-5 candles trending in the same direction before recognizing a harami as meaningful reversal architecture.
Bulkowski ranks the bullish harami 38th of 103 candle types for overall performance and the bearish harami 72nd, against 84th and 91st for the two engulfing patterns. Both variants are common: frequency ranks 25 and 26 respectively.
The Bullish vs. Bearish Harami Structure
The bullish harami identifies a potential uptrend reversal following a long red mother candle, whereas the bearish harami signals a potential decline after a large green mother candle.
A bullish harami appears during a downtrend as a red candle (mother) followed by a green candle (baby) contained within it. The red mother shows selling dominance. The green baby, contained within the red body, signals that buyers stepped in but couldn’t sustain the advance. This partial buyer interest combined with seller exhaustion creates the reversal setup.
A bearish harami appears during an uptrend as a green candle (mother) followed by a red candle (baby) inside it. The green mother shows buying dominance. The red baby signals that sellers appeared but were contained by buyers, yet the containment suggests buying pressure is weakening. This is why the pattern often precedes a reversal downward.
Ready to Elevate Your Trading?
You have the information. Now, get the platform. Join thousands of successful traders who use Volity for its powerful tools, fast execution, and dedicated support.
Create Your Account in Under 3 MinutesHow reliable is the harami pattern in 2026?
The published figures for the harami are close to random. Bulkowski tested both variants and found each resolves in its stated direction 53% of the time, which means the pattern earns its place as a warning rather than as a trade.
Equity markets are where the pattern was tested. Bulkowski’s bullish harami result of 53% comes from stock data, with a best 10-day move of 4.05% in a bear market, and he rates a move of 6% or better as good. Stocks give cleaner harami formations than intraday forex because the sessions are discrete, but the harami does not become a reversal signal on its own because of it.
Forex accuracy differs because decentralized pricing creates broker-specific price variations. The major pairs (EUR/USD, GBP/USD) have no published harami win rate at all, because Bulkowski’s testing is on stocks. What forex adds is 24/5 liquidity, where small retracements produce containment patterns that are structurally valid and mean nothing. Only harami patterns at Fibonacci levels or round-number support are worth marking.
Timeframe selection changes what the pattern means. On daily and weekly charts a harami represents a full session of price discovery; on a 15-minute chart it usually represents algorithmic range consolidation rather than genuine trend exhaustion. A harami on a daily chart reflects an entire day of price discovery. A harami on a 15-minute chart often vanishes within the next hour as algorithmic traders push through the range.
A bullish harami forming while the RSI is below 30 has a second, independent reason to expect buyers, which is not true of one that forms mid-range. That is a confluence argument, and no published test puts a number on it.
Is the Harami Cross more reliable than the standard variant?
A harami cross identifies a state of complete market equilibrium where the baby candle forms as a doji within the mother candle’s body.
The Harami Cross represents an extreme version of the standard harami. Instead of a normal baby candle (with a distinct body), the baby is a Doji, the open and close are nearly identical. This near-zero body signals maximum indecision. Buyers and sellers fought throughout the entire candle, yet neither side gained ground. The result is a visual representation of complete equilibrium.
This equilibrium makes the Harami Cross more explosive in terms of reversal probability. When price reaches this state of perfect balance, the next move is often violent as the market “breaks the tie” in one direction. A standard harami shows slight containment; a Harami Cross shows absolute balance.
Institutional sentiment gravitates toward Harami Crosses at major Fibonacci support levels during sustained downtrends. When buyers and sellers reach complete equilibrium at a 61.8% retracement of a prior rally, the subsequent breakout often marks the reversal point that institutions have been targeting.
Risk-reward management becomes tighter with Harami Cross setups. A standard harami requires a stop-loss 1.5x the mother candle’s height below the formation. A Harami Cross, due to its greater conviction, allows a stop placed just 5-10 pips below the entry without the same frequency of false touches.
Worked illustration of the rule: a Harami Cross forms on a Daily chart at the 61.8% Fibonacci retracement of a prior rally. The mother candle is a large red body, the baby is a Doji contained within it, and both RSI and Stochastic are oversold. None of that is the trade. The trade is the close above the mother candle’s high, with the mother’s low as invalidation and the 38.2% retracement as the first target. If price never clears the mother’s high, the setup expires unfilled. This is an illustration of the rule, not a record of a specific trade. Past performance is not indicative of future results.
Why do harami patterns fail and how to avoid “Fake-outs”?
Pattern failure identification reveals the critical impact of missing confirmation on the success of contained candlestick formations.
| Filter Type | Bulkowski tested behaviour | What confirmation adds | Primary Risk |
| Bullish Harami | Bullish reversal 53% | A close above the mother candle high | Bull Trap |
| Bearish Harami | Bullish continuation 53% | A close below the mother candle low | Bear Trap |
| Harami Cross | Not separately tested | A close beyond the mother candle | Sudden News Spike |
| Low Volume Baby | Not separately tested | Volume drop confirms exhaustion | Range Expansion |
| High Volume Baby | Not separately tested | Heavy volume contradicts the pause | Contradictory Signal |
Tested behaviour and rankings from Thomas Bulkowski: bullish harami and bearish harami. Bulkowski does not publish separate results for the Harami Cross or for volume-filtered variants.
A standalone harami, one that is not followed by a confirming breakout, barely exceeds random chance in Bulkowski’s testing. The bearish variant is the trap: it resolves upward more often than downward, so traders who short a bearish harami on sight watch price continue higher the next session and exit at a loss before any reversal arrives.
The “Bull Trap” occurs when a harami forms after an uptrend decline, appears ready to reverse, but instead the market rips higher and triggers all the stop-losses placed below the mother candle’s low. This is the most common failure scenario. Retail traders spot the pattern, place stops too tight, and get stopped out while institutional buyers are aggressively accumulating.
The “Bear Trap” mirrors this setup in downtrends. Traders short on a bearish harami, place stops above the mother candle’s high, and the market gaps up through them on a surprise positive news event or economic report, liquidating positions before resuming the downtrend.
News-driven failures plague harami patterns during high-impact economic releases. A perfectly formed Harami Cross at support might be invalidated when a central bank unexpectedly maintains interest rates, triggering algorithmic selling that bypasses the technical pattern entirely.
Trading Strategies: The “Mother-High” Breakout Entry
Trade execution identifies the high-probability entry point as the moment price breaks beyond the vertical range of the first mother candle.
The conservative entry approach waits for a full candle close above the mother’s high. This sacrifices a handful of pips but eliminates the risk of entering into a false wick that temporarily pierces the level. A trader spots a bullish harami, waits for the next candle, and only enters once that candle closes firmly above the mother’s high on strong volume.
The aggressive entry hits a market order the moment price touches the mother candle’s high during the next session, before waiting for a full candle close. This approach captures the move earlier but risks being stopped out by algorithmic wick-hunting. Professional traders prefer the conservative approach when trading with leverage.
Stop-loss placement is structural: set the stop just below the mother candle’s low for a bullish harami, or just above the mother candle’s high for a bearish one. This keeps the invalidation level outside the pattern itself. A bullish harami stop at 1.0450 means the stop is placed 5-10 pips below the mother’s lowest point, not exactly at the low where algorithms cluster their triggers.
Profit taking uses multiple approaches. The conservative method targets the previous swing high before the trend reversed. A bullish harami forming after a 200-pip decline might target the recent swing high where the decline originated. The aggressive method uses a 1:2 or 1:3 risk-to-reward ratio based on the mother candle’s total height. If the mother candle is 50 pips tall and the stop is 10 pips away, the profit target is 40 pips (1:2) or 60 pips (1:3) above the entry.
Stop-loss placement is covered in full separately; the harami rule is simply that the invalidation level sits outside the mother candle.
Turn Knowledge into Profit
You have done the reading, now it is time to act. The best way to learn is by doing. Open a free, no-risk demo account and practice your strategy with virtual funds today.
Open a Free Demo AccountHarami vs. Engulfing: Identifying momentum loss vs. momentum reversal
Pattern comparison identifies the functional difference between an engulfing candle’s aggressive take-over and a harami’s passive deceleration.
An engulfing pattern shows a second candle that completely surrounds the first candle’s range, it is larger than the mother, not smaller. The engulfing candle indicates momentum is reversing aggressively. Buyers completely overwhelmed the sellers (in a bullish engulfing) or vice versa. This is a momentum reversal.
A harami shows a second candle that is contained within the first, indicating momentum is simply decelerating. Sellers or buyers appeared but couldn’t sustain control. The first candle’s dominance is still present, just weakened. This is momentum loss, not reversal.
Bulkowski’s tests put the engulfing patterns ahead on raw direction, at 79% for the bearish engulfing and 63% for the bullish, against 53% for both harami variants, because an engulfing candle is a decisive momentum shift and a harami is only hesitation. The key distinction: engulfing = aggressive reversal, harami = passive deceleration that often precedes reversal.
Key Takeaways
- Harami candlestick patterns are two-candle formations signaling trend exhaustion where a small baby candle is contained by a large mother candle.
- Bulkowski measured the bullish harami as a bullish reversal 53% of the time, so the confirming breakout above the mother candle is what makes it tradable.
- The Harami Cross utilizes a Doji as the second candle, indicating a complete loss of directional control and a more explosive potential reversal.
- Volume confirmation is critical, as a high-conviction harami requires a significant drop in trading volume during the formation of the baby candle.
- Signal validation only occurs when the price breaks the high or low of the first mother candle, reducing the risk of false “range-traps.”
- Stop-loss placement should be set strictly outside the range of the mother candle to protect against high-frequency liquidity hunts.
Frequently Asked Questions
This article contains references to the harami candlestick pattern and Volity, a regulated CFD trading platform. This content is produced for educational purposes only and does not constitute financial advice or a recommendation to execute any specific trading strategy using harami patterns. Candlestick patterns vary in reliability across asset classes, timeframes, and market conditions; always verify your broker’s trading rules and risk management policies before trading. Some links in this article may be affiliate links.