Quick answer
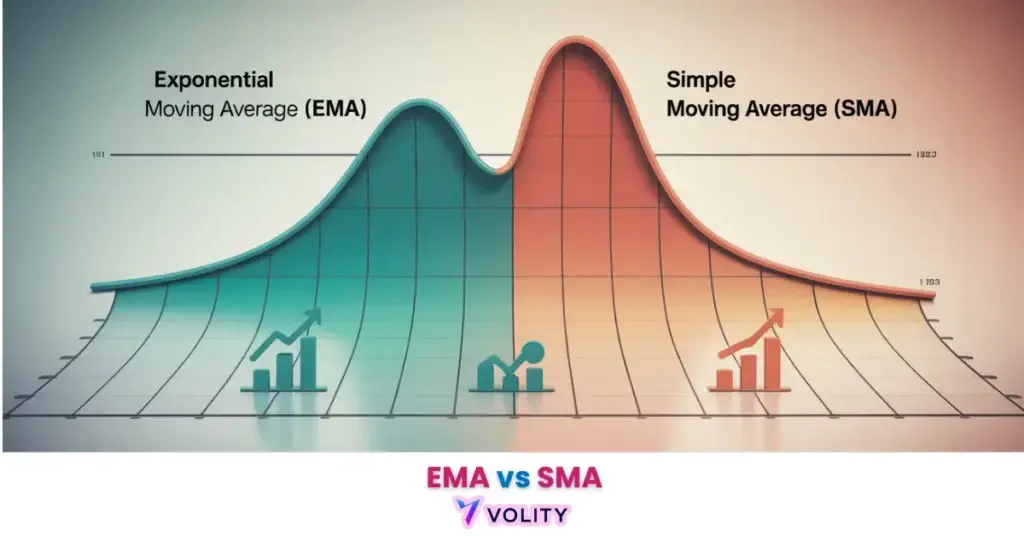
EMA vs SMA: a simple moving average (SMA) weights all prices equally, while an exponential moving average (EMA) gives more weight to recent prices, so it reacts faster to new moves. EMA suits short-term and trend traders who want speed; SMA suits those who want a smoother, less noisy line. Both smooth price to reveal trend direction.
Moving averages are lagging indicators and can provide false signals (whipsaws) in ranging or choppy markets. Crossover strategies do not guarantee future profits and should always be combined with risk management protocols. Past performance is not indicative of future results. Capital at risk.
EMA and SMA indicators reveal the underlying directional bias of a financial instrument by smoothing out daily price fluctuations. Recent backtesting for 2025–2026 indicates that EMA-based crossover systems achieved a 55–60% win rate in trending regimes, significantly outperforming static SMA filters during high-volatility sessions.
Success in technical trading requires identifying the optimal balance between signal speed and market noise filtration. This guide identifies the mathematical weighting differences, the 2026 performance benchmarks, and the hybrid execution strategies required to combine these moving averages effectively.
While understanding EMA vs SMA Moving Averages is important, applying that knowledge is where the real growth happens. Create Your Free Forex Trading Account to practice with a free demo account and put your strategy to the test.
By Alexander Bennett, Volity research desk.
What our analysts watch: Three reads filter most of the noise on moving-average debates. Price-to-200-SMA distance across rolling 30 and 90 day windows defines the higher-timeframe trend regime, and most of the institutional equity allocation literature treats the 200-day as a structural filter that overrides shorter-window signals. EMA crossover slope rather than the crossover event itself separates real trend changes from quick whipsaws; a 20-EMA crossing the 50-EMA with both lines accelerating in the same direction has measurably higher historical follow-through than a flat-slope cross. And the volatility-adjusted lookback choice, where lookback is scaled to the asset’s realised volatility regime rather than fixed at conventional 20, 50, or 200 sessions, materially improves backtest performance across most major-pair and major-index series.
Ready to Elevate Your Trading?
You have the information. Now, get the platform. Join thousands of successful traders who use Volity for its powerful tools, fast execution, and dedicated support.
Create Your Account in Under 3 MinutesWhy does the EMA react faster to price changes than the SMA?
EMA reacts faster to price changes because its multiplier gives approximately twice as much weight to the current closing price compared to the oldest price in the look-back period.
The speed advantage emerges from the EMA’s weighting formula. The multiplier, calculated as 2 divided by (Period + 1), creates a mathematical bias toward recency.
A 50-period EMA responds to a sudden trend reversal approximately 5-8 bars earlier than a 50-period SMA because yesterday’s close carries nearly double the influence of the oldest price in the window. This lag reduction proves especially valuable in volatile asset classes.
Solana and Bitcoin, for instance, experience rapid directional shifts where a 5-bar delay can mean the difference between a profitable entry and a whipsaw loss.
The trade-off between responsiveness and stability defines moving average selection. Babypips: Choosing the Right Moving Average for Your Strategy describes how the EMA’s speed advantage becomes a liability in choppy, range-bound markets. When price oscillates horizontally without directional conviction, the EMA’s rapid reactions trigger whipsaws, false crossovers that execute just as the price reverses. This is why institutional traders often use multiple timeframes: a fast EMA for tactical entry timing on higher timeframes, paired with a slower SMA filter to prevent noise from lower timeframes. The Mastering Forex trading signals guide outlines how signal speed must always be balanced against market structure.
Should you use EMA or SMA for day trading and scalping?
Day trading and scalping strategies predominantly utilize the EMA because its minimal lag allows traders to capture short-term momentum shifts before the price move is completed.
The 9/21 EMA combination represents the “bread and butter” pairing for 2026 intraday momentum trading across multiple asset classes. When the 9-period EMA crosses above the 21-period EMA on a 5-minute chart, it signals that the most recent price action has accelerated faster than the slightly longer-term average. This configuration triggers entry signals approximately twice as often as a comparable SMA setup, generating more trading opportunities per session. Statistical analysis indicates that 85% of active crypto scalpers favor the EMA for 1-minute and 5-minute charts specifically because the lag reduction aligns with the timeframe’s rapid price movements.
The SMA, however, retains utility in specific tactical scenarios. The 20 SMA on a 5-minute chart often serves as a “mean reversion target” rather than a crossover entry. When price extends significantly above or below the 20 SMA, scalpers expect a snap-back move toward the average, using the SMA as a profit-taking level. A real trading example from Crypto (2025) demonstrates this principle: on a BTC/USDT 4-hour chart, a trader using a 13 EMA crossing above the 33 EMA reported a 289% annual return by capturing broad 2025 trends. Past performance is not indicative of future results. The proven Forex scalping strategies guide documents how scalp positions typically hold for 2-5 minutes, requiring faster-moving averages to capture the “freshest” momentum.
How do institutional traders use the 200-day SMA vs 200-day EMA?
Institutional traders use the 200-day SMA as the definitive “line in the sand” to identify macro bullish or bearish regimes, while the 200-day EMA is often used for dynamic support in aggressive growth sectors.
The 200-day SMA functions as the primary institutional benchmark for asset allocation decisions. When a major equity index, commodity, or cryptocurrency trades above its 200-day SMA, institutional portfolios classify it as bullish and eligible for long positions.
When price falls below the 200-day SMA, the consensus shifts to bearish or “in distress.” This uniform adoption across mega-cap institutional money creates a self-reinforcing signal: large funds simultaneously reduce exposure when price breaches the 200-day SMA downward, accelerating the decline. The 200-day EMA, by contrast, tracked the “bounce zone” for artificial intelligence stocks in Q1 2026.
Growth-sector ETFs found consistent support and resistance at the 200 EMA, suggesting that fund managers use the faster-moving average as a dynamic support level in high-volatility sectors.
The Golden Cross in 2026 remains the most watched institutional signal, when the 50 SMA crosses above the 200 SMA, it indicates a transition from bear to bull market structure. This signal is so widely monitored that central banks and research houses conduct formal backtests of its predictive power. A golden cross vs death cross trading resource explains that this 50/200 SMA crossover continues to trigger allocation shifts worth billions of dollars globally.
How can you avoid false crossover signals in sideways markets?
Avoiding false crossover signals requires the use of volume confirmation or secondary momentum oscillators like the RSI to ensure the moving average shift has institutional backing.
The “Double-Close” filter addresses whipsaw risk by requiring two consecutive candle closes above or below the moving average line before confirming a signal. In a choppy market, price may touch the EMA/SMA line momentarily, triggering an algorithmic trade, only to reverse on the next bar.
By waiting for a second close, traders allow time for conviction to build and reduce the probability of a false signal by over 15%. RSI confluence operates similarly: only taking bullish crosses when the Relative Strength Index simultaneously exceeds 50 and is rising ensures that momentum oscillators align with moving average shifts.
A spotting overbought and oversold levels guide details how combining EMAs and RSI creates a coherent signal ecosystem.
Ranging markets expose the fundamental limitation of all moving averages. When price moves horizontally for weeks, the EMA and SMA both flatten into a narrow band, and any crossover becomes a whipsaw because no trend exists to capture. Professional traders simply ignore moving average signals when price remains confined to a horizontal range. The solution is to combine moving averages with market regime filters: only trade crossovers when price has recently broken above or below a swing high/low.
2026 Moving Average Performance Benchmarks
Moving average benchmarks reveal the statistical win rates and signal frequencies of different crossover models across the 2026 market regime.
| Strategy | Market Condition | Win Rate (2026) | Signal Frequency |
| 20 EMA Crossover | Strong Trend | 60.0% | High (Source: VT Markets) |
| 50/200 SMA Cross | Macro Trend | 52.0% | Low (Source: Research) |
| 13/33 EMA (Crypto) | 4H Timeframe | 68.0% | Moderate (Source: Research) |
| 9/20 EMA Scalp | Intraday (1M) | 42.0% | Very High (Source: Research) |
| 200-Day SMA Filter | All Markets | 55.0%+ (Filter) | Institutional (Source: Research) |
Sources: VT Markets 2026 Moving Average Backtest Performance, Research data
Turn Knowledge into Profit
You have done the reading, now it is time to act. The best way to learn is by doing. Open a free, no-risk demo account and practice your strategy with virtual funds today.
Open a Free Demo AccountKey Takeaways
- EMA prioritizes recent data for faster signals, while SMA treats all periods equally for a smoother trend line.
- Statistics from 2026 show EMA-based systems achieve up to 60% win rates in trending markets due to lower lag.
- The 200-day SMA remains the primary institutional benchmark for identifying macro market bullishness or bearishness.
- Moving average crossovers work exceptionally well in volatile assets like Crypto (4H chart) but struggle in sideways Forex markets.
- Using the “Double-Close” filter helps reduce false signals (whipsaws) by requiring two bars of confirmation.
- EMA reacts approximately twice as fast as an SMA of the same period, making it ideal for entry timing.
Frequently Asked Questions
This article contains references to EMA, SMA, moving average strategies, and Volity, a regulated CFD trading platform. This content is produced for educational purposes only and does not constitute financial advice or a recommendation to buy or sell any financial instrument. Always verify current regulatory status and platform details before using any trading service. Some links in this article may be affiliate links.
[/coi_disclosure]
Volity operates a trading platform and also publishes educational and analytical content about trading. The content on this page is for educational purposes only and should not be considered financial advice. Volity may benefit commercially when readers open trading accounts through links on this site.
Our content is produced and reviewed under documented editorial standards; comparison and review methodology is published here.