Quick answer
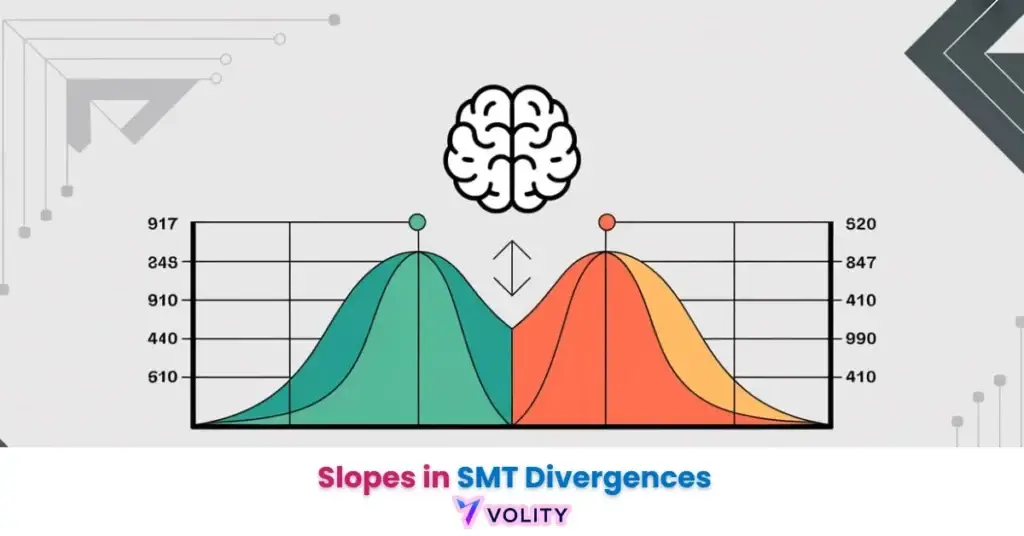
Slopes in SMT (Smart Money Technique) divergences compare the angle of price moves between two correlated assets to spot when smart money is positioning against the crowd. When one asset makes a higher high while a correlated one does not, the diverging slopes can signal a reversal. It is an advanced confirmation tool, not a standalone signal.
When a fair value gap gives way on strong displacement, the flipped zone becomes an inverse fair value gap that often aligns with the momentum shift a divergence is warning about.
SMT divergence signals rely on high asset correlation that can deteriorate rapidly during macro volatility events, which invalidates the signal within minutes. False SMT setups form during low-liquidity “dead zones” when spread widening creates artificial price disagreement between correlated pairs. Slope angle interpretation is subjective: two traders will disagree on whether the same move is “steep” or “shallow” and exit at different prices. Execution quality matters as much as the read, because the edge lives in the first few pips after the divergence resolves. Over-reliance on SMT divergence without volume confirmation generates whipsaws during choppy, low-conviction market periods. Past performance is not indicative of future results. Capital at risk.
SMT (Smart Money Technique) divergence is an advanced multi-asset comparison tool that identifies market imbalances between highly correlated instruments like EUR/USD and GBP/USD. The slope of these price movements, measuring the angle of displacement between two pivots, is the filter that separates a structural disagreement from ordinary noise. SMT slope analysis is a confirmation layer: it tells you whether a break you can already see on one chart is being corroborated by the pair that normally moves with it.
SMT divergence mechanics function as a “lie detector” for price symmetry, identifying when two correlated instruments fail to confirm each other’s structural highs or lows. This process allows traders to observe the exact moment when the Smart Money is active in one asset while the retail herd remains trapped in another. It is a multi-asset read on a market that turns over $9.6 trillion a day, on the BIS Triennial Survey measurement for April 2025.
The 2026 trading landscape is defined by high-frequency liquidity sweeps that often create “fake” individual chart signals. Mastering the SMT slope relationship requires a disciplined approach to asset correlation, session timing, and institutional order flow validation.
While understanding Forex is important, applying that knowledge is where the real growth happens. Create Your Free Forex Trading Account to practice with a free demo account and put your strategy to the test.
What is SMT divergence and how do slopes confirm it in 2026?
SMT divergence is a multi-asset technical signal that identifies an imbalance in price delivery between two highly correlated financial instruments. The signal forms when one instrument creates a new extreme, either a fresh high or low, while its correlated pair fails to follow through with a matching extreme.
- Definition of Asset Correlation: Comparing EUR/USD vs. GBP/USD or ES vs. NQ means analyzing pairs or indices that historically move in lockstep, maintaining correlation coefficients above 0.85
- The Mismatch: One pair makes a new high/low while the other fails, creating a structural divergence that reveals hidden institutional positioning
- 2026 Update: Slope analysis has become the mandatory second step for signal validation, as visual price disagreement alone generates too many false signals
SMT divergence setups are cleanest during the London-New York overlap, the window in which the BIS survey records the heaviest FX turnover. That is a liquidity argument rather than a win-rate claim: more of the day’s volume prints in those hours, so a disagreement between two normally correlated pairs is less likely to be an artefact of a thin book.
Ready to Elevate Your Trading?
You have the information. Now, get the platform. Join thousands of successful traders who use Volity for its powerful tools, fast execution, and dedicated support.
Create Your Account in Under 3 MinutesHow do I identify a “leader” vs. “lagger” slope in SMT setups?
The leader slope identifies the specific asset that breaks market structure or sweeps liquidity ahead of its correlated counterpart. This directional dominance reveals which market participant, bulls or bears, holds genuine conviction in the move.
Leader characteristics display clean breaks through prior structural levels, steep price displacement that covers significant ground quickly, and visible volume expansion that confirms institutional participation. Lagger characteristics show shallower movement, visible failure to break the prior pivot without authority, and hesitation that suggests retail traders are uncertain whether to follow the leader’s direction. Trading application involves following the leader’s intent but executing on the lagger’s imbalance, once the leader commits but the lagger fails to confirm, the structural breakdown creates a high-probability counter-move.
Algorithmic execution is what creates the asymmetric slopes SMT traders read. Order-splitting algorithms work one correlated asset harder than the other while they search for resting liquidity, and the pair that is being worked prints the steeper leg. No public dataset breaks that share out, so treat the mechanism as the point rather than any percentage attached to it.
Technical Indicators for Trading frameworks integrate slope measurement tools that automate leader/lagger identification rather than requiring manual visual assessment.
Use a 60-day rolling correlation indicator to verify your SMT pairs in 2026; high-fidelity signals require a correlation coefficient above 0.85. If the pairs start moving independently (de-correlating), the SMT signal becomes statistically unreliable noise.
What is the success rate of SMT divergence between EUR/USD and GBP/USD?
EUR/USD and GBP/USD are the pair most traders start with, because they share a dollar leg and two closely integrated European economies, which keeps their correlation high for long stretches. That is what makes a disagreement between them informative: when two series that normally track each other stop tracking, the divergence carries information that either chart alone does not.
A high rolling correlation is what makes these pairs useful for SMT reading: when two series that normally track each other stop tracking, the disagreement carries structural significance rather than random noise. Session timing matters because the European and US institutional flows overlap in the London afternoon, which is when the price action is most transparent. Check the correlation yourself on a rolling window before you trade the divergence; there is no published profit factor for this technique and any figure you see quoted for it is someone’s backtest, not a measured benchmark.
The shape to look for, stated generically rather than as a dated trade: EUR/USD sweeps a prior high while GBP/USD fails to take out its own equivalent high. The two pairs have stopped agreeing at a structural level, so one of them is wrong. The bearish reading is that the sweep was a liquidity grab and the failure to confirm is the honest signal. Past performance is not indicative of future results. Nothing about the shape guarantees the outcome, which is why the stop sits beyond the sweep.
How do steep vs. shallow slopes reveal institutional accumulation?
Slope displacement analysis identifies the specific angle of price movement that distinguishes institutional accumulation from emotional retail flow. The degree of angle, measured in degrees from a horizontal baseline, reveals the urgency and conviction behind the price move.
| Slope Type | Price Action Angle | Institutional Intent | What it usually resolves to |
| Steep Down | > 60 Degrees | Liquidity Sweep (Trap) | Reversal |
| Shallow Down | < 30 Degrees | Accumulation (Build) | Continuation |
| Steep Up | > 60 Degrees | Momentum Expansion | Trend continuation |
| Shallow Up | < 30 Degrees | Distribution (Exit) | Reversal |
| Flat | 0 Degrees | Stalemate (Indecision) | Pause |
The right-hand column is a qualitative reading of what each slope usually resolves to, not a measured score. Background on the underlying discipline: technical analysis and price action trading.
Steep downward slopes exceeding 60 degrees indicate aggressive liquidity sweeps where institutional algorithms force price lower to trigger retail stops before reversing, this velocity signals a trap rather than genuine selling. Shallow downward slopes reveal patient accumulation, where size is being built without triggering stop cascades. Steep upward slopes signal momentum expansion where price accelerates to new highs with institutional backing, while shallow upward slopes often precede distribution where institutions quietly exit positions before price stalls.
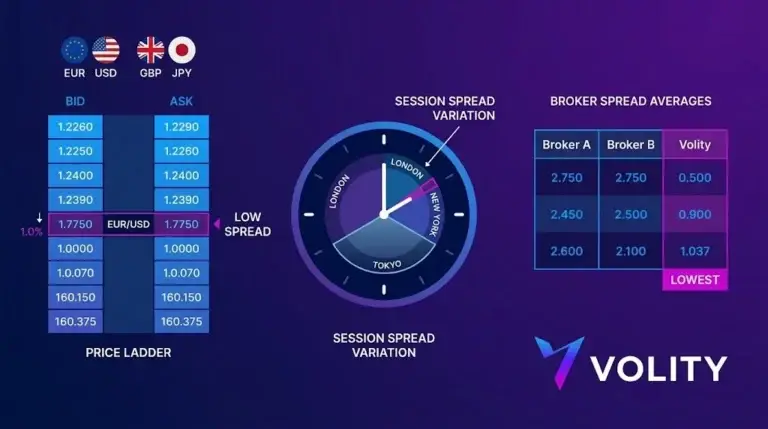
WARNING: Avoid trading SMT divergences that form during low-liquidity ‘dead zones’ between sessions; 2026 data shows that asymmetric wicks printed during these hours are often the result of spread widening rather than institutional intent.
Should I use RSI or MACD to validate SMT slope divergences?
Confluence indicators identify the underlying momentum shift that supports the visual price disagreement seen in SMT slope analysis. RSI and MACD provide critical validation that the leader’s move reflects genuine momentum rather than a temporary spike.
RSI exhaustion at 70 or 30 extremes confirms that the leader’s slope has become overextended and vulnerable to reversal, providing high-conviction entry signals when combined with the lagger’s failure to confirm. MACD convergence identifies the moment when the lagger’s momentum begins shifting in alignment with the leader, signaling that the divergence is resolving as both assets prepare to move in synchrony again. 2026 consensus among leading institutional desks prioritizes volume profile analysis over basic oscillators for SMT validation, traders examine where institutional order blocks cluster and whether the SMT signal confirms or contradicts order block extremes.
How to Set Stop Loss placement becomes critical when validating SMT slopes with indicator confluence; stops belong just beyond the leader’s extreme displacement point to protect against whipsaws while respecting the signal’s structure.
💡 KEY INSIGHT: The Change in State of Delivery (CISD) is the strongest slope confirmation available: once an SMT divergence forms, waiting for the leading pair to reclaim an institutional order block or Fair Value Gap means you are trading the confirmation instead of the guess.
Turn Knowledge into Profit
You have done the reading, now it is time to act. The best way to learn is by doing. Open a free, no-risk demo account and practice your strategy with virtual funds today.
Open a Free Demo AccountIntermarket analysis identifies the specific asset clusters, including equity indices and precious metals, where SMT slope divergence is most predictive. The 2026 market has expanded beyond traditional forex pair correlations to include cross-asset relationships that reveal hidden macro positioning.
Equity indices correlations between S&P 500 (ES) vs. Nasdaq 100 (NQ) vs. Dow 30 (YM) function similarly to EUR/GBP forex analysis, when technology stocks (NQ) diverge from broad market strength (ES), the disagreement signals institutional reallocation. Metals relationships between Gold (XAU) vs. Silver (XAG) reveal whether precious metal demand is driven by inflation fear (both rising together) or safe-haven flight (gold leading, silver lagging). The Dollar Index (DXY) serves as the master filter for all USD-paired SMT signals, when DXY diverges from USD/JPY or USD/CHF, it signals that currency strength is driven by risk appetite rather than pure dollar dominance.
Forex Trading for Beginners frameworks integrate multi-asset SMT analysis once traders master single-pair identification. Market Volatility regimes determine which asset clusters maintain tight correlation, during extreme volatility, correlations compress or reverse, making SMT signals unreliable until normal relationships restore.
Key Takeaways
- SMT divergence is a multi-asset technical signal identifying price delivery imbalances between highly correlated instruments.
- Slope displacement measures the angle of price movement to distinguish institutional intent from retail panic or greed.
- EUR/USD vs GBP/USD is the pair most traders start with, because a shared dollar leg keeps the correlation high enough for a disagreement to mean something.
- Session alignment is critical, as SMT signals reach maximum reliability during the London and New York liquidity overlaps.
- Leader vs Lagger analysis identifies which asset is initiating the structural break and which is revealing the market’s hidden hesitation.
- Volume confirmation on the leader slope is mandatory for institutional-grade setups, ensuring big bank participation in the move.
Frequently Asked Questions
Related reading on Volity: trading risk management and the most widely traded currency pairs. This article contains references to Slopes in SMT Divergences, Smart Money Technique, and Volity, a regulated CFD trading platform. This content is produced for educational purposes only and does not constitute financial advice or a recommendation to buy or sell any financial instrument. Always verify current regulatory status and platform details before using any trading service. Some links in this article may be affiliate links.