Fibonacci extensions are lagging technical indicators that do not predict future price movements. Extensions provide statistical levels but lack 100% accuracy. Past performance is not indicative of future results. Capital at risk.
Fibonacci extensions identify projected price targets beyond the initial impulse move, calculated from the 1.618 to 4.236 ratios. Traders use them to set profit targets that are decided before the trade rather than in the middle of it, which is most of the value.
Fibonacci extensions identify natural price targets where trend moves exhaust based on mathematical proportions found throughout nature and financial markets. Understanding extension levels provides traders with precise profit targets that reflect institutional exit points.
In 2026, Fibonacci methodology has become foundational for professional traders seeking to balance reward potential against realistic entry risk. Extensions distinguish aggressive entries from prudent risk management by defining where profits should crystallize.
While understanding Fibonacci Extensions is important, applying that knowledge is where the real growth happens. Create Your Free Forex Trading Account to practice with a free demo account and put your strategy to the test.
What are Fibonacci extensions and how do they work?
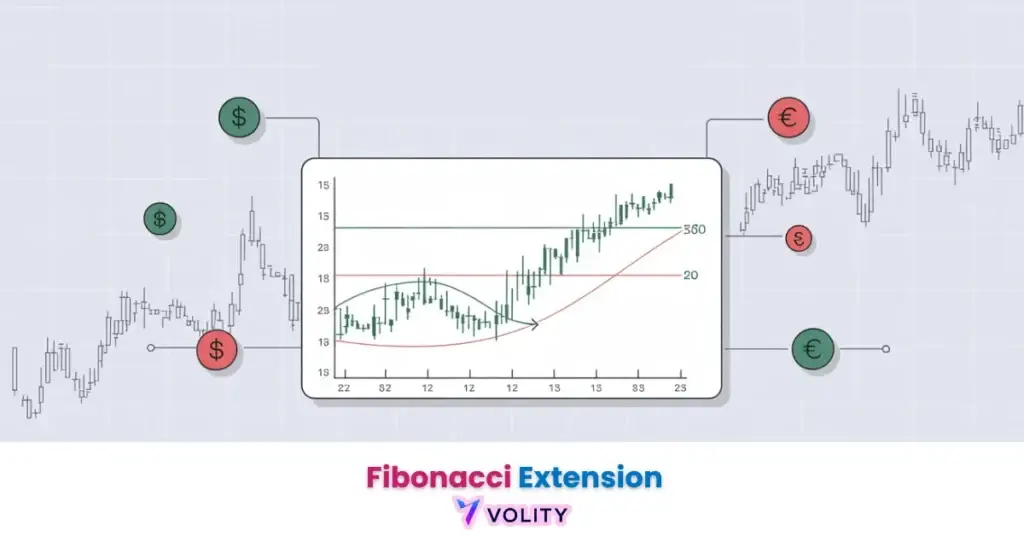
Fibonacci extensions identify projected price targets beyond an initial price move using ratios derived from the Fibonacci sequence (1.618, 2.618, 3.618, 4.236).
The methodology begins with identifying an impulse move (a strong directional price advance). From the start and end of that impulse, traders calculate the distance (100%). Fibonacci extension ratios project where price might move after the impulse exhausts. The 1.618 extension typically provides the first major target (capturing an additional 61.8% of the original move), while the 2.618 extension identifies secondary targets. The mathematical basis is the Fibonacci sequence, in which each number is the sum of the prior two and the ratio of successive terms approaches the golden ratio of roughly 1.618. This appears throughout nature, spiraling galaxies, seashells, botanical patterns, creating psychological significance in markets where millions of traders independently use identical ratios, creating self-fulfilling technical levels.
The fibonacci retracements guide explains how retracements differ from extensions by projecting into prior moves rather than beyond impulses.
Ready to Elevate Your Trading?
You have the information. Now, get the platform. Join thousands of successful traders who use Volity for its powerful tools, fast execution, and dedicated support.
Create Your Account in Under 3 MinutesFibonacci Extensions vs. Retracements: Understanding the Directional Difference
For the retracement counterpart, see our Fibonacci retracement guide; pair both with Elliott Wave Theory for confluence.
The distinction between extensions and retracements identifies whether traders project into prior moves (retracements) or beyond new moves (extensions).
Retracements occur when price pulls back within a prior bullish move, the 50% retracement identifies the midpoint where traders typically expect buyers to support price. Extensions occur when price breaks the prior swing high and continues upward, the 1.618 extension projects where the extended move might terminate. Professional traders use both methodologies: retracements for entries (buying dips) and extensions for exits (setting profit targets). Combining both creates a complete trading framework where you identify extended moves, plan exits at extension levels, then set stop-losses at retracement failures. Neither tool carries an edge on its own; what they give you is a consistent way to place entries and exits.
The support and resistance guide explains how Fibonacci levels combine with structural levels to identify high-conviction zones; Wikipedia covers the underlying support and resistance concept and the Fibonacci retracement construction extensions are derived from.
How to calculate Fibonacci extensions accurately
Calculating extensions requires identifying the correct wave start and end points, which varies based on market structure and timeframe.
Step 1: Identify the strongest impulse move (avoiding false starts and pullbacks). Step 2: Measure the distance from low to high (or high to low in downtrends). Step 3: Multiply that distance by 1.618, 2.618, 3.618 ratios. Step 4: Plot those extension levels as horizontal lines from the impulse end point. Common errors include using incorrect wave start points (traders often miss the exact low or high) and applying extensions to partial moves rather than complete impulses. Advanced traders verify extension levels by cross-referencing with Elliott wave theory and assessing confluence with moving averages or previous support/resistance zones.
Fibonacci extensions combined with other technical indicators
An extension level is worth more when something else agrees with it: volume behaviour, a moving average, or a momentum reading at the same price.
Volume Surge at extension levels indicates institutional selling pressure, heavy volume suggests price has truly exhausted momentum. Moving Average Confluence where the 200-day EMA intersects a Fibonacci extension increases the probability that price will reverse. RSI Divergence at extensions where price makes new highs but RSI fails to confirm signals potential exhaustion before extension targets are reached. These confluence factors separate high-probability extensions from false technical levels that trap traders.
Turn Knowledge into Profit
You have done the reading, now it is time to act. The best way to learn is by doing. Open a free, no-risk demo account and practice your strategy with virtual funds today.
Open a Free Demo AccountManaging risk when trading Fibonacci extensions
Stop-loss placement beyond the impulse start point provides capital protection when extension-based trades fail.
For bullish moves with targets at the 1.618 extension, place stops below the impulse low by 15-25 pips (depending on volatility) to protect against swift reversals that invalidate the extension projection. Risk-to-reward targets of 2:1 or 3:1 ensure that winning trades more than compensate for inevitable losing signals. Position sizing using the 1-2% risk rule ensures that extension-based trades, even when they fail, preserve account capital for future opportunities.
Key Takeaways
- Fibonacci extensions project price targets beyond impulse moves using ratios (1.618, 2.618, 3.618, 4.236) derived from the Fibonacci sequence.
- The 1.618 extension is the primary profit target of the set and the one most other participants are also watching.
- Extensions differ from retracements by projecting beyond new price moves rather than into prior pullbacks.
- Confluence with volume behaviour or a moving average is what separates a level worth trading from a line in open space.
- Stop-loss placement below the impulse start point protects capital when extension-based trades invalidate.
- Fibonacci extensions provide objective profit targets that reflect institutional exit points and natural market equilibrium levels.
Frequently Asked Questions
This article contains references to Fibonacci analysis, technical analysis, and Volity, a regulated CFD trading platform. This content is produced for educational purposes only and does not constitute financial advice. Always test Fibonacci strategies on demo accounts before deploying live capital. Some links may be affiliate links.
What our analysts watch: Fibonacci extensions are a probability tool, not a destiny tool. Three context filters separate textbook performance from live-account drawdowns. Trend regime confirmation before drawing the extension (extensions only carry edge inside an established impulsive structure; in ranging markets the same levels print as random walk noise). Confluence with structural levels (an extension that aligns with a prior swing high, a major moving average, or a horizontal resistance carries materially higher hit rates than a standalone Fibonacci print in open space). Volume and momentum behaviour as price approaches the level (volume expansion into a 161.8 print signals continuation through; volume contraction signals exhaustion and reversal at the level). The 161.8 level earned its reputation across decades of charting because traders treat it as a self-fulfilling target. Extensions beyond 261.8 are statistically rarer and most often print during parabolic late-cycle moves rather than in normal trending conditions.
Related guides
Volity operates a trading platform and also publishes educational and analytical content about trading. The content on this page is for educational purposes only and should not be considered financial advice. Volity may benefit commercially when readers open trading accounts through links on this site.
Our content is produced and reviewed under documented editorial standards; see our comparison and review methodology.