Investing in financial products involves risk. Losses may exceed the value of your original investment.
Risk reward ratio is a core topic for traders in 2026. The complete guide follows.
The math nobody talks about: why most traders fail at risk-reward ratios
The market doesn’t price your conviction. It prices your entry, your exit, and whether you sized the trade like an adult.
So it’s no surprise that “1:2 risk-reward” has become the trading internet’s favourite hymn. Risk one.
Make two. Repeat.
However, most people quoting it haven’t done the one piece of arithmetic that matters: the break-even win rate.
If you risk 1 to make 2, your break-even win rate sits around 33.3%. Add friction, and it’s closer to 34%. Therefore you can be wrong almost two thirds of the time. Still, you can finish green.
That sounds like freedom. Meanwhile, for a lot of traders, it becomes a trap.
The part nobody likes: the ratio is not the edge
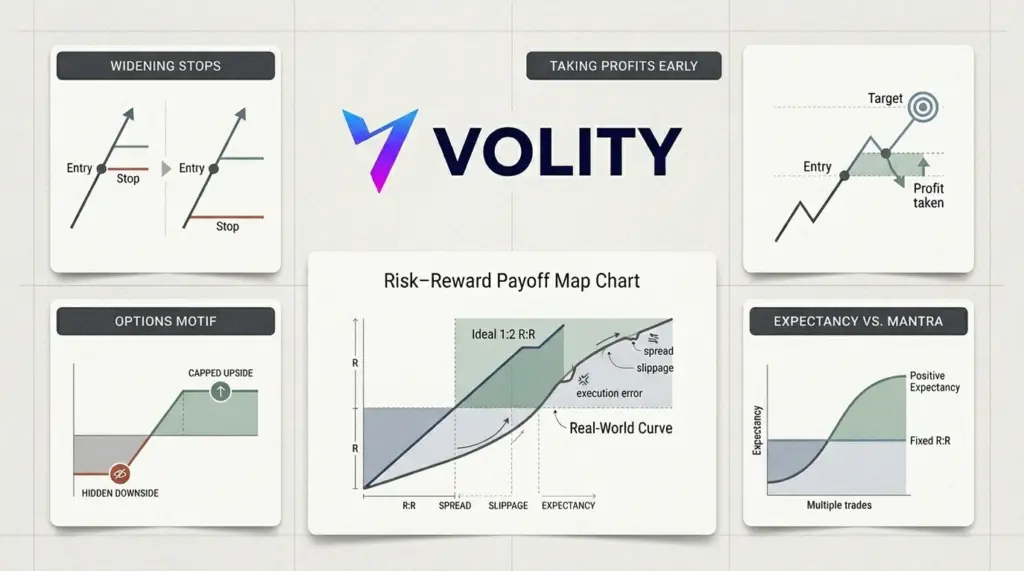
A risk-reward ratio is just a payoff map. It tells you what happens if you execute cleanly. It does not tell you whether the trade is good. Yet many traders treat “1:2” like a quality stamp, then wonder why the equity curve looks like a heart monitor.
Consider what often happens in real markets. Volatility compresses, spreads widen, and price chops around a level for three sessions.
However, the trader keeps the same stop distance and the same target. The maths stays neat.
The trade expectancy does not.
Options make this even more obvious. A vertical spread can hard-code the outcome, which feels comforting. Therefore the trader focuses on “return on risk” and forgets that the underlying can change character mid-week. Meanwhile, gamma and time decay do their own thing.
April’s bounce was a good example of “clean” trades that can still be dumb
In the week of April 17–24, traders crowded into bullish structures after a sharp risk-on move in tech. Plenty of setups looked tidy on paper. However, tidy payoffs don’t rescue poor trade management.
An Apple put spread like selling the $245 put and buying the $240 put for about $0.75 credit risks roughly $4.25 to make $0.75. That’s not 1:2. It’s the opposite. Yet people still call it “good risk-reward” because the probability feels high.
A similar Robinhood spread, say short $63 and long $55 for about $1.13 credit, risks about $6.87 to make $1.13. Again, the payoff is capped and small. Therefore the entire game becomes: avoid being wrong, often for weeks, for a modest reward.
That approach can work. But it is a different sport from “risk 1 to make 2”. Meanwhile, many traders blend the two ideas and end up with the worst of both.
When 1:2 quietly fails
Fixed reward multiples collapse when the market’s best exit is not a multiple. It’s a level.
If price is running into a gap fill, a prior high, or a heavy volume node, that is supply. However, the mechanical trader holds because they are “not at 2R yet”. The market then turns, and the winner becomes a scratch. Therefore the trader learns the wrong lesson: “targets don’t work”.
On the other side, stops get distorted by emotion. The trader widens the stop “to give it room”, which destroys the ratio. Meanwhile, they still take profits early “to lock it in”, which destroys it again. That is how you get a system that loses while pretending it is disciplined.
Win rate and ratio: you can’t optimise one and ignore the other
A scalper might live around 1:1 because the move is measured in ticks, not narratives. However, costs matter more, so the win rate must be higher.
A swing trader can hunt 1:2 or 1:3 because the structure is wider and the move can breathe. Therefore the win rate can fall, yet expectancy can rise.
Day traders sit in the awkward middle. Meanwhile, they often copy swing targets with intraday patience, then wonder why the tape doesn’t oblige.
The covered-call reality check
Some of the most revealing “risk-reward” stories are not about a single trade. They are about path dependency.
A trader can collect, say, $89,000 in premium while sitting on a $250,000 drawdown in the underlying. The options income looks heroic. However, the mark-to-market is still ugly. Therefore the only question that matters is whether the exposure was intentional, priced, and survivable.
Consistency can be a real edge. Meanwhile, “consistent” does not mean “safe”. It means repeatable sizing, repeatable entry criteria, and exits that respect what price is doing.
What actually works in practice
The traders who survive tend to do three boring things. First, they risk small, often 1–2% per trade. Second, they let the market tell them where the exit should be, then they check whether the payoff is worth it. Third, they track expectancy rather than bragging about win rate.
So yes, 1:2 can be a powerful filter. However, it is not a substitute for structure, liquidity, and a plan you can execute when you’re tired and slightly annoyed.
- Ratios don’t create edge, they reveal it when the setup is sound.
- Mechanical targets fail when price meets real supply or demand before “2R”.
- Emotion breaks the maths through widened stops and early profit-taking.
- Different timeframes need different payoffs, because volatility and costs change.
- Survival beats elegance, because you can’t compound if you blow up.
Key takeaways
- Calculate your break-even win rate for your costs, not a textbook’s.
- Set targets at levels, then accept or reject the trade based on the implied R multiple.
- Never widen a stop to “protect the ratio”. That is how ratios become fiction.
- Track average win and average loss weekly. It’s the quickest lie detector.
- If you sell premium, stop calling it 1:2. Treat it as a probability business.
What our analysts watch: Three lenses dominate our reading of the equity tape. Sector rotation tells us where capital is moving (defensives versus cyclicals, value versus growth).
Earnings revisions show whether analyst expectations are catching up to or trailing reality. Real yields and the dollar set the discount rate that valuation multiples respond to.
When earnings estimates rise faster than the index price and real yields stabilise, the setup tends to favour patient longs.
Frequently asked questions
How much money do I need to start trading stocks?
Many regulated brokers now allow account opening with no minimum deposit and offer fractional shares for as little as $1. A practical starting balance for a long-only beginner is $500 to $2,000, enough to diversify across a handful of positions without paying meaningful percentage spreads. The FCA publishes investor education resources worth reading before opening an account.
What is the difference between stocks, ETFs, and CFDs?
A stock is direct ownership in a company. An ETF is a basket of stocks (or other assets) traded as a single security. A CFD (contract for difference) is a leveraged derivative that tracks the underlying price without conferring ownership. Each has different cost, tax, and risk profiles. ESMA imposes leverage caps on retail CFDs in the EU and UK.
How do I choose a trustworthy broker?
Verify regulation with a tier-one authority (FCA in the UK, CySEC in Cyprus, BaFin in Germany, ASIC in Australia, or your local regulator). Check segregated client funds, negative-balance protection, transparent fees, and a clean disciplinary record. Avoid any platform offering guaranteed returns or pressuring deposits. The FCA Financial Services Register is free to search.
Should I day-trade or invest long-term?
Most retail accounts that day-trade lose money over time. Long-term passive investing in diversified index ETFs has historically delivered competitive returns with far less effort and lower stress. Active day-trading can work, but it requires capital, an edge proven over hundreds of trades, and the time to monitor positions intraday. Start passive; layer active only after the basics are durable.
Related guides
- Risk management in forex trading
- Forex trading for beginners
- Best forex trading strategies
- Setting up a forex trading account
- Best trading platforms
Volity operates a trading platform and also publishes educational and analytical content about trading. The content on this page is for educational purposes only and should not be considered financial advice. Volity may benefit commercially when readers open trading accounts through links on this site.
Our content is produced and reviewed under documented editorial standards; comparison and review methodology is published here.