Investing in financial products involves risk. Losses may exceed the value of your original investment.
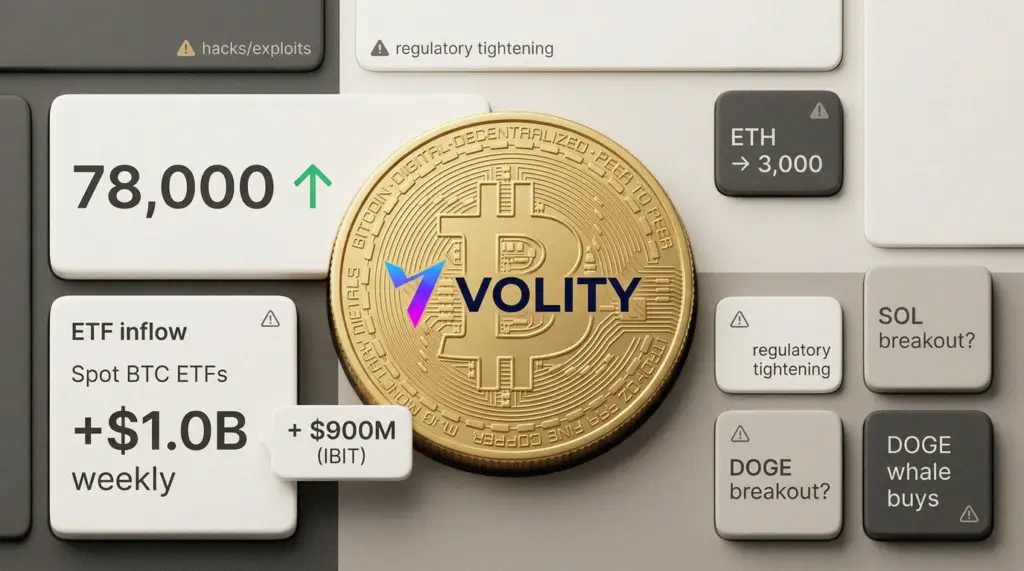
Crypto rallies as bitcoin clears $78,000, with ETFs doing the heavy lifting
Bitcoin pushed through $78,000 on Thursday, extending a risk-on swing that has crept back into markets. Traders pointed to easing geopolitical headlines and a familiar accelerant, spot Bitcoin ETFs. Meanwhile, the day’s loudest number came from BlackRock’s iShares Bitcoin Trust, which the draft says added $900 million worth of Bitcoin.
Price action did not look like a late-cycle retail stampede. Instead, it read like institution-led accumulation, with steadier bids and less of the frantic weekend churn. However, the wider market still behaved like crypto, with sharp rotations, meme bursts and sudden air pockets. Therefore, the rally came packaged with its usual fine print, hacks, enforcement, and the growing anxiety around what happens when quantum computing stops sounding theoretical.
Bitcoin back in command, as flows and positioning tighten supply
Bitcoin dipped below $75,000 earlier this month, then rebounded hard. That bounce coincided with renewed appetite for risk and stronger ETF demand in the US. Meanwhile, weekly spot ETF inflows were described as nearing $1 billion, which matters because the ETFs can turn paper optimism into physical buying.
That dynamic also helps explain why Bitcoin has tended to regain leadership during macro relief rallies. However, once Bitcoin stabilises, traders often go hunting for higher beta elsewhere. Therefore, today’s move quickly turned into an argument about whether this was a clean trend or the start of another crowded chase.
- Dogecoin “whales” were said to have bought roughly $330 million, eyeing a move above $0.1018.
- Solana was framed as a potential double-bottom setup, with a $110+ breakout level in view.
- Ethereum was pitched as a candidate for a push towards $3,000, tied to network activity and DeFi tone.
In the large-cap table, Bitcoin and Ethereum stayed on top, with USDT and USDC anchoring liquidity. Meanwhile, Solana and Dogecoin remained the preferred vehicles for traders who want volatility with a big tape. Hyperliquid, tagged as HYPE, popped up as a newer entrant in the conversation, a reminder that listing buzz has returned.
Alt rotation returns, but conviction looks patchy
Speculators rotated into memecoins and mid-caps, chasing what desks often call “alt beta”. However, most of that trade works only when Bitcoin behaves. If Bitcoin chops, alt liquidity evaporates, and spreads widen fast. Therefore, the question is not which token can jump 20% in an afternoon, but which projects can keep bids when volatility flips.
The draft nods to gaming and DeFi builds, plus jostling among meme projects. Meanwhile, the market seems to be relearning an old lesson, narrative helps but structure pays. Real usage, stickier liquidity, and clear token economics tend to last longer than a slogan.
Hacks keep coming, and operational risk remains the tax on upside
While prices rose, attackers stayed busy. A KelpDAO exploit allegedly moved funds from Ethereum across Arbitrum and into Tron-based USDT. Meanwhile, Volo Protocol reportedly froze vaults after a $3.5 million exploit on Sui. Umbra shut its front end after thieves routed funds through it.
The draft claims total crypto hacks reached $17 billion over a decade. However, the more troubling shift is not the headline number. Attackers increasingly chase keys, permissions, and human error. Therefore, custody practices, signing policies, and off-chain controls matter as much as the code.
North Korea’s Lazarus Group was also flagged for new macOS malware aimed at crypto executives. Meanwhile, bug bounty programmes face a different kind of flood, with AI-generated reports that waste analyst time. Quantum worries sat in the background, with Coinbase cautioning against delay and Ripple discussing quantum-proofing by 2028.
Regulators tighten the net, even as politics sends mixed signals
Enforcement did not take the day off. The draft cites a UK watchdog raiding eight London sites for illegal peer-to-peer trading. Meanwhile, Europe’s MiCA deadlines continue to reshape exchange and stablecoin planning. In the US, the CLARITY Act was described as advancing, while Russia was said to be pushing a licensing framework with retail caps.
Yet policy is not one-way. A potential Fed chair pick, Kevin Warsh, was characterised as making pro-crypto noises. Therefore, the market is stuck reading tea leaves, tougher rules in some lanes, and friendlier rhetoric in others.
- Coinbase spent $1.07 million on Q1 lobbying, according to the draft’s figures.
- New York’s attorney general was said to be suing Coinbase and Gemini over prediction markets.
- 35% of European investors were cited as willing to leave banks for better crypto access.
Big tech and “AI agents” nudge crypto closer to payments plumbing
Alongside the price action, the draft rounds up a familiar convergence. Google launched a $750 million fund for partner-led AI deployments. Meanwhile, Coinbase integrated Nium for instant USDC payouts and promoted work around post-quantum chains, including Algorand and Aptos. It also mentioned Agentic.market, pitched as AI agents paying for services with stablecoins.
Some of this is real infrastructure. However, some of it reads like marketing wrapped around a bull tape. Therefore, traders should separate payment rails and settlement tools from “passive income” bait that tends to multiply in rising markets.
What traders are watching next
Bitcoin above $78,000 is a clean headline, yet the rally’s durability depends on flows and volatility control. Meanwhile, the security drumbeat and regulatory noise have not eased. Therefore, positioning that assumes a straight line higher often ends badly in crypto, even in strong regimes.
By the numbers
- Bitcoin level in focus: $78,000
- BlackRock reported BTC add: $900 million
- Weekly spot ETF inflows: near $1 billion
- Volo Protocol exploit cited: $3.5 million
- Decade hack total cited: $17 billion
Key takeaways
- Watch ETF flow days, they still set the tone for intraday momentum.
- Respect the rotation, but size alts for liquidity that can vanish quickly.
- Security headlines can gap tokens regardless of chart patterns.
- Regulation remains a two-speed story, expect sudden jurisdiction shocks.
- Quantum “future risk” is becoming a present narrative driver, especially for majors.
For more on this topic see our deep-dives on Bitcoin and ETF Outflows: How Crypto Reacts to Fund Selling, Bitcoin and Bank Crypto-Backed Loans: Sberbank Sets a Template, and Crypto Rally: Robinhood, Bitcoin ETFs and Ethereum’s CROPS Catalyst.
What our analysts watch: For ETF-led BTC moves, we sit with three series. First, daily creation and redemption baskets, because that is the cleanest read on whether allocators are buying spot or selling into strength.
Second, futures basis on CME, since rich basis often pulls cash-and-carry arbitrage that caps blow-off tops. Third, exchange-held supply, because falling reserves alongside ETF inflows compress the float and amplify any fresh demand.
When all three align, follow-through tends to outlast a single news cycle.
Frequently asked questions
How do spot Bitcoin ETF inflows actually move the BTC price?
Authorised participants buy spot BTC from market makers to deliver against creation orders, which converts dollar inflows into real exchange demand within one to two trading days. The CoinDesk Bitcoin price hub tracks the daily flows alongside spot moves, which is why a $900m print at BlackRock often shows up as a clean grind rather than a wick.
What is the difference between a spot ETF and a futures ETF?
A spot ETF holds the underlying coin in regulated custody, while a futures ETF holds CME-listed contracts that roll monthly and pay basis. Roll costs usually drag futures-ETF performance below spot. The SEC statement on spot Bitcoin products outlines the approval framework that distinguished the two structures.
Why does BTC sometimes lead, then alts run?
Rotations follow risk appetite. Bitcoin tends to lead during macro relief rallies because ETF flows are concentrated there. Once BTC stabilises, traders rotate into Solana, Ethereum, and memecoins for higher beta. The IMF tracks crypto-market integration in its IMF fintech notes, which cover spillover risks between BTC and global risk assets.
How does MiCA in Europe affect access to Bitcoin ETFs and exchanges?
MiCA tightens authorisation, marketing, and stablecoin rules across the EU, which narrows the list of compliant venues. Cyprus-licensed brokers operating under CySEC 186/12, including UBK Markets, list approved crypto-derivative instruments under MiFID, while EU-domiciled spot ETPs continue to trade on Xetra and SIX. Traders should verify both listing venue and custody arrangements before allocating.
Related guides
- Bitcoin explained
- Cryptocurrency trading
- Crypto trading platforms
- Best crypto investments
- Spot trading platforms
Volity operates a trading platform and also publishes educational and analytical content about trading. The content on this page is for educational purposes only and should not be considered financial advice. Volity may benefit commercially when readers open trading accounts through links on this site.
Our content is produced and reviewed under documented editorial standards; comparison and review methodology is published here.