Fibonacci-Extensions sind nachlaufende technische Indikatoren, die zukünftige Preisbewegungen nicht vorhersagen. Extensions liefern statistische Niveaus, bieten jedoch keine 100-prozentige Genauigkeit. Die Wertentwicklung in der Vergangenheit ist kein Indikator für zukünftige Ergebnisse. Kapital ist gefährdet.
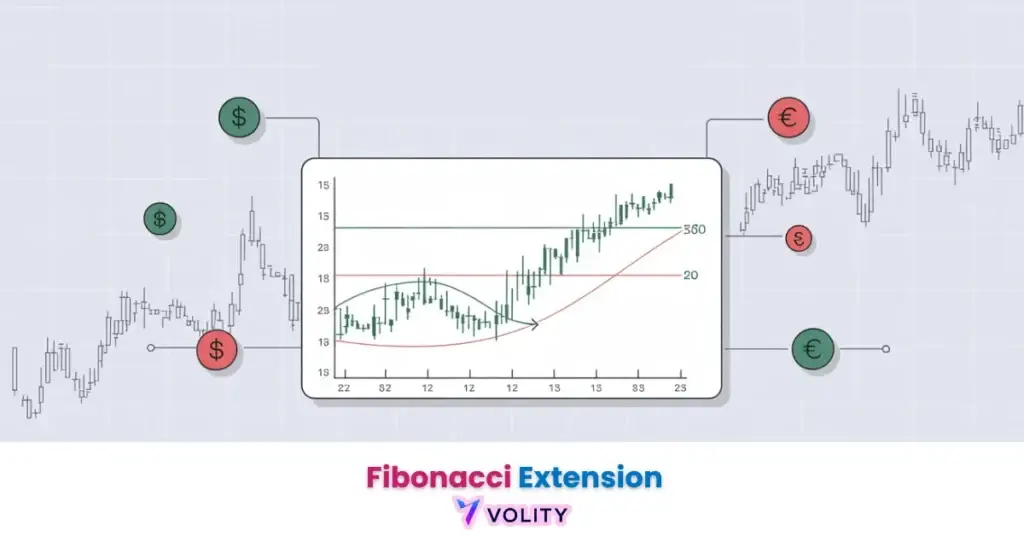
Fibonacci-Extensions identifizieren projizierte Kursziele jenseits der anfänglichen Impulsbewegung, berechnet anhand der Verhältnisse von 1,618 bis 4,236. Trader nutzen sie, um Gewinnziele schon vor dem Trade festzulegen statt mitten im Trade, und darin liegt der größte Teil ihres Nutzens.
Fibonacci-Extensions identifizieren natürliche Kursziele, an denen Trendbewegungen erschöpft sind, basierend auf mathematischen Proportionen, die in der Natur und auf den Finanzmärkten vorkommen. Das Verständnis der Extension-Niveaus bietet Tradern präzise Gewinnziele, die institutionelle Ausstiegspunkte widerspiegeln.
Im Jahr 2026 ist die Fibonacci-Methodik für professionelle Trader, die das Ertragspotenzial gegen ein realistisches Einstiegsrisiko abwägen möchten, grundlegend geworden. Extensions unterscheiden aggressive Einstiege von einem umsichtigen Risikomanagement, indem sie definieren, wo Gewinne realisiert werden sollten.
Das Verständnis von Fibonacci Extensions ist wichtig, doch echtes Wachstum entsteht erst durch die Anwendung dieses Wissens. Kostenloses Forex-Handelskonto erstellen, um mit einem kostenlosen Demokonto zu üben und Ihre Strategie zu testen.
Was sind Fibonacci-Extensions und wie funktionieren sie?
Fibonacci-Extensions identifizieren projizierte Kursziele jenseits einer anfänglichen Preisbewegung unter Verwendung von Verhältnissen, die aus der Fibonacci-Folge abgeleitet sind (1,618, 2,618, 3,618, 4,236).
Die Methodik beginnt mit der Identifizierung einer Impulsbewegung (ein starker, gerichteter Preisanstieg). Vom Start- und Endpunkt dieses Impulses berechnen Trader die Distanz (100 %). Fibonacci-Extension-Verhältnisse projizieren, wohin sich der Preis bewegen könnte, nachdem der Impuls erschöpft ist. Die 1,618-Extension liefert typischerweise das erste große Ziel (das weitere 61,8 % der ursprünglichen Bewegung erfasst), während die 2,618-Extension sekundäre Ziele identifiziert. Die mathematische Grundlage ergibt sich aus der Fibonacci-Folge (jede Zahl entspricht der Summe der beiden vorherigen), wobei sich die Verhältnisse 1,618 (dem „goldenen Schnitt“) annähern, je weiter die Folge reicht. Dies erscheint in der gesamten Natur, in spiralförmigen Galaxien, Muscheln und botanischen Mustern, was eine psychologische Bedeutung auf Märkten schafft, auf denen Millionen von Tradern unabhängig voneinander identische Verhältnisse verwenden, wodurch sich selbst erfüllende technische Niveaus entstehen.
Der Leitfaden zu Fibonacci-Retracements erklärt, wie sich Retracements von Extensions unterscheiden, indem sie in frühere Bewegungen hinein projizieren, anstatt über Impulse hinaus.
Bereit, Ihr Trading auf das nächste Level zu bringen?
Sie haben das Wissen. Jetzt fehlt die Plattform. Schließen Sie sich Tausenden erfolgreichen Tradern an, die Volity für leistungsstarke Tools, schnelle Ausführung und engagierten Support nutzen.
Erstellen Sie Ihr Konto in unter 3 MinutenFibonacci-Extensions vs. Retracements: Den richtungsweisenden Unterschied verstehen
Für das Gegenstück der Retracements siehe unseren Fibonacci-Retracement-Leitfaden; kombinieren Sie beide mit der Elliott-Wellen-Theorie für eine Konfluenz.
Die Unterscheidung zwischen Extensions und Retracements identifiziert, ob Trader in frühere Bewegungen (Retracements) oder über neue Bewegungen hinaus (Extensions) projizieren.
Retracements treten auf, wenn der Preis innerhalb einer früheren bullischen Bewegung zurückfällt; das 50-Prozent-Retracement identifiziert den Mittelpunkt, an dem Trader typischerweise erwarten, dass Käufer den Preis stützen. Extensions treten auf, wenn der Preis das vorherige Swing-Hoch durchbricht und weiter steigt; die 1,618-Extension projiziert, wo die erweiterte Bewegung enden könnte. Professionelle Trader nutzen beide Methoden: Retracements für Einstiege (Kauf bei Rücksetzern) und Extensions für Ausstiege (Festlegung von Gewinnzielen). Die Kombination beider schafft einen vollständigen Handelsrahmen, in dem Sie erweiterte Bewegungen identifizieren, Ausstiege auf Extension-Niveaus planen und dann Stop-Losses bei Retracement-Fehlschlägen setzen. Keines der beiden Werkzeuge verschafft für sich allein einen Vorteil, zusammen liefern sie aber eine konsistente Methode, um Einstiege und Ausstiege zu setzen.
Der Leitfaden zu Unterstützungs- und Widerstandsniveaus erklärt, wie Fibonacci-Niveaus in die traditionelle strukturelle Unterstützung/Widerstand integriert werden, um Handelszonen mit hoher Überzeugung zu identifizieren.
Wie man Fibonacci-Extensions genau berechnet
Die Berechnung von Extensions erfordert die Identifizierung der korrekten Wellenstart- und Endpunkte, was je nach Marktstruktur und Zeitrahmen variiert.
Schritt 1: Identifizieren Sie die stärkste Impulsbewegung (vermeiden Sie Fehlstarts und Rücksetzer). Schritt 2: Messen Sie die Distanz vom Tief zum Hoch (oder Hoch zum Tief bei Abwärtstrends). Schritt 3: Multiplizieren Sie diese Distanz mit den Verhältnissen 1,618, 2,618, 3,618. Schritt 4: Zeichnen Sie diese Extension-Niveaus als horizontale Linien vom Endpunkt des Impulses aus ein. Häufige Fehler sind die Verwendung falscher Wellenstartpunkte (Trader verpassen oft das exakte Tief oder Hoch) und die Anwendung von Extensions auf Teilbewegungen anstatt auf vollständige Impulse. Erfahrene Trader verifizieren Extension-Niveaus durch Querverweise mit der Elliott-Wellen-Theorie und die Bewertung der Konfluenz mit gleitenden Durchschnitten oder früheren Unterstützungs-/Widerstandszonen.
Fibonacci-Extensions kombiniert mit anderen technischen Indikatoren
Ein Extension-Niveau ist mehr wert, wenn etwas anderes es auf demselben Kursniveau bestätigt: das Volumenverhalten, ein gleitender Durchschnitt oder ein Momentum-Oszillator.
Ein Volumenanstieg auf Extension-Niveaus deutet auf institutionellen Verkaufsdruck hin; ein hohes Volumen deutet darauf hin, dass der Preis das Momentum wirklich erschöpft hat. Eine Konfluenz gleitender Durchschnitte, bei der sich der 200-Tage-EMA mit einer Fibonacci-Extension überschneidet, erhöht die Wahrscheinlichkeit, dass der Preis umkehrt. RSI-Divergenz bei Extensions, bei denen der Preis neue Hochs erreicht, der RSI dies aber nicht bestätigt, signalisiert eine potenzielle Erschöpfung, bevor die Extension-Ziele erreicht werden. Diese Konfluenzfaktoren trennen Extensions mit hoher Wahrscheinlichkeit von falschen technischen Niveaus, die Trader in die Falle locken.
Wissen in Gewinn verwandeln
Sie haben gelesen, jetzt ist es Zeit zu handeln. Der beste Weg zu lernen ist durch Praxis. Eröffnen Sie ein kostenloses, risikofreies Demokonto und üben Sie Ihre Strategie noch heute mit virtuellem Guthaben.
Kostenloses Demokonto eröffnenRisikomanagement beim Handel mit Fibonacci-Extensions
Die Platzierung eines Stop-Loss jenseits des Startpunkts des Impulses bietet Kapitalschutz, wenn auf Extensions basierende Trades fehlschlagen.
Platzieren Sie bei bullischen Bewegungen mit Zielen an der 1,618-Extension die Stops 15-25 Pips unter dem Impulstief (abhängig von der Volatilität), um sich gegen schnelle Umkehrungen zu schützen, die die Extension-Projektion entwerten. Risiko-Ertrags-Ziele von 2:1 oder 3:1 stellen sicher, dass gewinnbringende Trades die unvermeidlichen Verlustsignale mehr als ausgleichen. Die Positionsgrößenbestimmung unter Verwendung der 1-2 %-Risikoregel stellt sicher, dass auf Extensions basierende Trades, selbst wenn sie fehlschlagen, das Kontokapital für zukünftige Gelegenheiten bewahren.
Wichtige Erkenntnisse
- Fibonacci-Extensions projizieren Kursziele jenseits von Impulsbewegungen unter Verwendung von Verhältnissen (1,618, 2,618, 3,618, 4,236), die aus der Fibonacci-Folge abgeleitet sind.
- Die 1,618-Extension ist das wichtigste Gewinnziel der Reihe und das Niveau, das auch die meisten anderen Marktteilnehmer beobachten.
- Extensions unterscheiden sich von Retracements dadurch, dass sie über neue Preisbewegungen hinaus projizieren, anstatt in frühere Rücksetzer hinein.
- Erst die Konfluenz mit dem Volumenverhalten oder einem gleitenden Durchschnitt unterscheidet ein handelbares Niveau von einer Linie im leeren Raum.
- Die Platzierung eines Stop-Loss unterhalb des Impulsstartpunkts schützt das Kapital, wenn auf Extensions basierende Trades ungültig werden.
- Fibonacci-Extensions bieten objektive Gewinnziele, die institutionelle Ausstiegspunkte und natürliche Marktgleichgewichtsniveaus widerspiegeln.
Häufig gestellte Fragen
Dieser Artikel enthält Verweise auf Fibonacci-Analysen, technische Analysen und Volity, eine regulierte CFD-Handelsplattform. Dieser Inhalt dient ausschließlich Bildungszwecken und stellt keine Finanzberatung dar. Testen Sie Fibonacci-Strategien immer auf Demokonten, bevor Sie echtes Kapital einsetzen. Einige Links können Affiliate-Links sein.
Was unsere Analysten beobachten: Fibonacci-Extensions sind ein Wahrscheinlichkeitswerkzeug, kein Schicksalswerkzeug. Drei Kontextfilter trennen die Performance aus Lehrbüchern von Drawdowns auf Live-Konten. Bestätigung des Trendregimes vor dem Zeichnen der Extension (Extensions haben nur einen Vorteil innerhalb einer etablierten Impulsstruktur; in Seitwärtsmärkten drucken dieselben Niveaus als zufälliges Rauschen). Konfluenz mit strukturellen Niveaus (eine Extension, die sich an einem früheren Swing-Hoch, einem wichtigen gleitenden Durchschnitt oder einem horizontalen Widerstand ausrichtet, hat wesentlich höhere Trefferquoten als ein eigenständiger Fibonacci-Druck im freien Raum). Volumen- und Momentumverhalten, wenn sich der Preis dem Niveau nähert (Volumenexpansion in einen 161,8-Druck signalisiert Fortsetzung; Volumenkontraktion signalisiert Erschöpfung und Umkehr am Niveau). Das 161,8-Niveau hat sich seinen Ruf über Jahrzehnte des Chartings verdient, weil Trader es als selbst erfüllendes Ziel behandeln. Extensions jenseits von 261,8 sind statistisch seltener und treten meist während parabolischer Bewegungen am späten Zyklus auf, nicht unter normalen Trendbedingungen.
Verwandte Leitfäden
- Beste Forex-Handelsstrategien
- Swing-Trading
- Risiko-Ertrags-Verhältnis
- RSI-Indikator
- Chart-Handelsplattformen
Volity betreibt eine Handelsplattform und veröffentlicht außerdem Bildungs- und Analyseinhalte zum Thema Trading. Die Inhalte dieser Seite dienen ausschließlich Bildungszwecken und sind nicht als Finanzberatung zu verstehen. Volity kann kommerziell profitieren, wenn Leser über Links auf dieser Website Handelskonten eröffnen.
Unsere Inhalte werden nach dokumentierten redaktionellen Standards erstellt und geprüft; siehe unsere Vergleichs- und Bewertungsmethodik.