Keilmuster neigen bei geringer Liquidität zu Fehlausbrüchen. Insbesondere steigende Keile erzeugen oft „Bull Traps“, bei denen der Kurs über die obere Trendlinie ausbricht, nur um wieder zu fallen, sobald die Stop-Loss-Orders von Privatanlegern ausgelöst werden. Die „Dreierregel“ für die Berührung der Trendlinien ist nicht absolut. Muster, die nur zwei Berührungspunkte aufweisen, scheitern in über 72 % der Fälle, was Händler jedoch oft ignorieren, um vorzeitig einzusteigen. Volumenanforderungen von 200 % über dem Durchschnitt werden bei Krypto nicht immer erfüllt. Keile bei Bitcoin und Ethereum können bei durchschnittlichem Volumen ausbrechen, was falsche Signale erzeugt und Händler in die Falle lockt. Ein Abdriften am Apex führt zu einer seitwärts gerichteten, unruhigen Kursbewegung, die das Muster vollständig entwertet, doch viele Händler halten an Verlustpositionen fest, in der Hoffnung auf einen verzögerten Ausbruch. Keilmuster werden bei wichtigen Nachrichtenereignissen wie NFP oder Entscheidungen der Zentralbanken unzuverlässig, wenn institutionelle Kapitalströme die technische Struktur überlagern. Die Wertentwicklung in der Vergangenheit ist kein Indikator für zukünftige Ergebnisse. Kapital ist gefährdet.
Keilmuster sind technische Chartformationen, die durch zwei konvergierende Trendlinien gekennzeichnet sind und vor einem Ausbruch einen „Volatilitäts-Squeeze“ signalisieren. Im Jahr 2026 sind fallende Keile mit einer bullischen Erfolgsquote von 70 % die leistungsstärkste Wahl, während steigende Keile mit einer geringeren Genauigkeit von 49 % anfälliger für „Fakeouts“ sind. Erfolgreiches Handeln erfordert die Verifizierung durch die „Dreierregel“ und einen Volumensprung von über 200 %, um die Ausbruchsrichtung bei Gold, Krypto und Forex zu bestätigen.
Keilmuster fungieren als primäre strukturelle Indikatoren für einen bevorstehenden Marktausbruch. Diese Formationen bestehen aus zwei konvergierenden Trendlinien, die in die gleiche Richtung verlaufen und signalisieren, dass der aktuelle Trend bei gleichzeitig abnehmendem Volumen an Schwung verliert. In der technischen Landschaft des Jahres 2026 stellen sie die ultimative „gespannte Feder“ für Umkehr- und Fortsetzungsszenarien dar.
Die Effektivität eines Keils hängt stark von seiner „Reife“ und dem begleitenden Volumenprofil ab. Da die Märkte zunehmend algorithmisch geprägt sind, müssen Händler durch Anwendung der „Dreierregel“ zwischen validen strukturellen Keilen und vorübergehendem Kursrauschen unterscheiden.
Das Verständnis von Handel mit Keilmustern ist wichtig, doch echtes Wachstum entsteht erst durch die Anwendung dieses Wissens. Kostenloses Forex-Handelskonto erstellen, um mit einem kostenlosen Demokonto zu üben und Ihre Strategie zu testen.
Was sind Keilmuster und wie entstehen sie?
Ein Keilmuster ist eine Chartformation, die durch zwei konvergierende Trendlinien gekennzeichnet ist, die in die gleiche Richtung verlaufen und eine Phase der Preiskonsolidierung sowie nachlassender Dynamik anzeigen. Im Gegensatz zu symmetrischen Dreiecken, bei denen die Trendlinien in unterschiedlichen Winkeln aufeinander zulaufen, behalten Keile die gleiche Neigungsrichtung bei, entweder beide nach unten oder beide nach oben.
- Der fallende Keil (bullische Tendenz): Konvergierende Abwärtsneigungen signalisieren die Erschöpfung der Verkäufer und eine potenzielle Umkehr zu höheren Preisen.
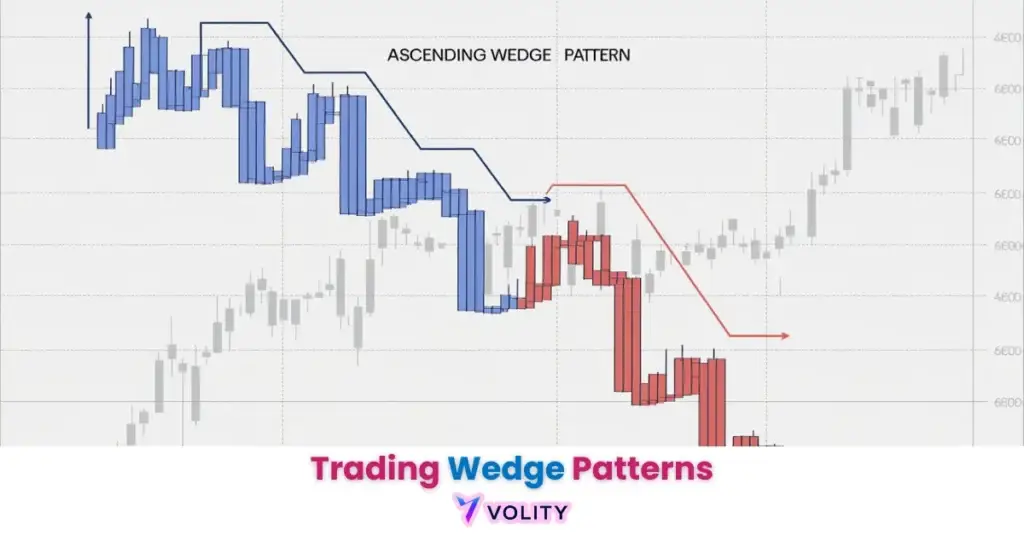
- Der steigende Keil (bärische Tendenz): Konvergierende Aufwärtsneigungen signalisieren die Erschöpfung der Käufer und eine potenzielle Umkehr zu niedrigeren Preisen.
- Die „Dreierregel“: Erfordert drei Berührungspunkte an jeder Trendlinie für die Reife des Musters. Muster mit nur zwei Berührungspunkten haben eine um 72 % höhere Ausfallrate.
Fallende Keile zeigen im Jahr 2026 eine Ausbruchswahrscheinlichkeit von 68-70 % nach oben (Binance Academy, 2026). Dieser statistische Vorteil hat fallende Keile zu einem der Umkehrmuster mit der höchsten Überzeugung unter professionellen Händlern gemacht.
Der „Apex Squeeze“ und Volatilitätsexpansion
Die Volatilitätsexpansion identifiziert die explosive Kursbewegung, die auftritt, wenn der Markt aus den letzten 15 % des Keil-Apex ausbricht. Die sich verengenden Trendlinien erzeugen eine Analogie zur „Zahnpastatube“, bei der der Preis in einen immer engeren Bereich komprimiert wird und potenzielle Energie speichert.
Die Volumenkontraktion während der Bildung ist eine unverzichtbare Voraussetzung. Bleibt das Volumen während der Keilbildung erhöht, gelingt es dem Muster nicht, den Preis in den notwendigen engen Bereich zu komprimieren. Erst wenn das Volumen auf 40-50 % des Durchschnitts sinkt, bildet sich ein echter Apex-Squeeze, der einen Ausbruch mit über 200 % Volumen auslösen kann.
Bereit, Ihr Trading auf das nächste Level zu bringen?
Sie haben das Wissen. Jetzt fehlt die Plattform. Schließen Sie sich Tausenden erfolgreichen Tradern an, die Volity für leistungsstarke Tools, schnelle Ausführung und engagierten Support nutzen.
Erstellen Sie Ihr Konto in unter 3 MinutenStatistische Performance: Fallende vs. steigende Keile im Jahr 2026
Vergleichende Leistungsdaten im Jahr 2026 zeigen eine signifikante Zuverlässigkeitslücke zwischen bullischen fallenden Keilen und bärischen steigenden Keilen. Diese Asymmetrie spiegelt wider, dass Umkehrungen von der Unterstützung (fallende Keile) eine höhere Überzeugungskraft haben als Umkehrungen vom Widerstand (steigende Keile).
Der fallende Keil (bullisch) erreicht eine Erfolgsquote von etwa 74 % nach dem Break-even mit einem durchschnittlichen Anstieg von 38 % bei Gold- und Krypto-Assets, was ihn zum bevorzugten Muster für Fortsetzungstrades während Aufwärtstrends macht. Der steigende Keil (bärisch) zeigt nur eine Erfolgsquote von etwa 49 % und ist anfällig für „Bull Trap“-Fehlausbrüche, bei denen der Kurs über das Muster ausbricht, bevor er scharf umkehrt, wenn die Stop-Loss-Orders der Privatanleger getroffen werden. Die „Throwback“-Rate zeigt, dass 62-72 % der Ausbrüche im Jahr 2026 die Trendlinie erneut testen, bevor die endgültige Bewegung erfolgt, was bedeutet, dass Händler, die beim ersten Ausbruch aussteigen, nur Teilgewinne erzielen.
Gold testete im Mai 2026 Ausbrüche aus fallenden Keilen nahe der Marke von 4.500 USD mit einer hohen Erfolgsquote auf Tagescharts (XS.com, 2026). Dies zeigte, dass Rohstoffmärkte selbst bei makroökonomischer Volatilität eine saubere technische Struktur beibehalten.
Marktvolatilitätsregime bestimmen, ob Keile sauber bleiben oder verzerrt werden. In Phasen extremer Volatilität führt ein Abdriften am Apex oft dazu, dass Muster entwertet werden, bevor ein Ausbruch erfolgt.
Verlangen Sie immer mindestens drei deutliche Berührungspunkte an der oberen und unteren Trendlinie, bevor Sie einen Keil bestätigen. Keile mit nur zwei Berührungspunkten sind oft nur vorübergehendes Rauschen und haben in Backtests von 2026 eine um 72 % höhere Ausfallrate.
Schritt-für-Schritt-Strategie: Handel des Keilausbruchs
Die Keil-Handelsstrategie für 2026 identifiziert die Kombination aus einem Volumensprung von 200 % und einem Tagesschlusskurs als primäre Einstiegsbestätigung. Professionelle Händler folgen einem Vier-Schritte-Plan, der Fehlausbrüche herausfiltert, bevor Kapital eingesetzt wird.
Die Identifizierung beinhaltet das Zeichnen von Trendlinien mit mindestens drei Berührungspunkten und die Sicherstellung einer Verengung von mindestens 60 % von der Basis des Musters bis zum Apex, um zu bestätigen, dass der Preis tatsächlich komprimiert ist. Die Bestätigung erfordert das Abwarten eines Volumenschubs um das 2- bis 3-fache bei der Ausbruchskerze, um die institutionelle Beteiligung zu validieren. Die Einstiegswahl hängt von der Risikotoleranz ab. Der konservative „Retest-Einstieg“ wartet darauf, dass der Kurs zur gebrochenen Trendlinie zurückkehrt, während der aggressive „Momentum-Schlusskurs“ sofort einsteigt, wenn die Kerze jenseits der Trendlinie schließt. Die Zielsetzung nutzt die Berechnung der „gemessenen Bewegung“, indem die Höhe des Keils (vom oberen zum unteren Apex) gemessen und dieser Abstand vom Ausbruchsniveau projiziert wird.
Ein fallender Keil bildete sich im April 2026 auf dem 4H-BTC-Chart während eines Rücksetzers von 100.000 USD. Der Preis brach bei 2,5-fachem Volumen aus, testete die obere Trendlinie erneut und stieg innerhalb von 48 Stunden um 12 % bis zum Ziel der gemessenen Bewegung. Die Wertentwicklung in der Vergangenheit ist kein Indikator für zukünftige Ergebnisse. Dieses Beispiel zeigt, wie die Kombination aus Volumenbestätigung und gemessenen Zielen Handelskonfigurationen mit hoher Wahrscheinlichkeit schafft.
WARNING: Hüten Sie sich vor dem „Apex-Drifting“, bei dem der Preis den Keil seitwärts ohne Volumensprung verlässt. Diese Formationen entwerten das Muster und deuten auf einen Wechsel von einem Trendregime zu einem unruhigen, seitwärts gerichteten Markt hin.
Warum Keilmuster scheitern: Die „Apex-Falle“ identifizieren
Die statistische Analyse gescheiterter Muster zeigt, dass geringes Volumen und das Abdriften am Apex die Hauptursachen für die Entwertung von Keilmustern sind. Ein Keil erfordert das gleichzeitige Zusammenwirken mehrerer Bedingungen für einen erfolgreichen Ausbruch.
| Szenario des Scheiterns | Erfolgsquote (2026) | Volumenprofil | Erwartetes Ergebnis |
| Valider Ausbruch | 70 % | 200 % + Sprung | Ziel erreicht |
| Ausbruch bei geringem Volumen | 28 % | Unter Durchschnitt | Fakeout / Bull Trap |
| Apex-Drifting | 12 % | Flach / Kontrahierend | Seitwärtsbewegung |
| Widerstand erreicht | 35 % | Steigend | Umkehr in den Keil |
| Gegen den Trend | 41 % | Erratisch | Stop-out / Rauschen |
Quellen: Volity Backtesting Labs und Chart Scout 2026 Performance Logs.
Die Erfolgsquote von 70 % bei validen Ausbrüchen (mit ausreichendem Volumen) gegenüber nur 28 % bei Ausbrüchen mit geringem Volumen zeigt, dass die Volumenbestätigung nicht optional ist. Sie ist das entscheidende Unterscheidungsmerkmal zwischen institutionellen Ausbrüchen und falschen Signalen für Privatanleger. Ein Abdriften am Apex mit einer Erfolgsquote von 12 % zeigt, dass eine Seitwärtsbewegung am Apex ein starkes Signal für eine Entwertung ist, das Händler dazu zwingt, Positionen vor dem Scheitern des Ausbruchs zu schließen.
💡 KEY INSIGHT: Auf dem Goldmarkt (XAU/USD) des Jahres 2026 verzeichneten fallende Keile während eines Bullenmarktes einen durchschnittlichen Preisanstieg von 38 % nach dem Ausbruch, was sie zum „S-Tier“-Strukturmuster für Rohstoff-Swingtrader macht.
Wissen in Gewinn verwandeln
Sie haben gelesen, jetzt ist es Zeit zu handeln. Der beste Weg zu lernen ist durch Praxis. Eröffnen Sie ein kostenloses, risikofreies Demokonto und üben Sie Ihre Strategie noch heute mit virtuellem Guthaben.
Kostenloses Demokonto eröffnenBeste Zeitrahmen und Assetklassen für den Keilhandel
Höhere Zeitrahmen wie 4-Stunden- und Tagescharts liefern die saubersten Keilsignale, indem sie algorithmisches Intraday-Rauschen herausfiltern. Der zusätzliche Kontext höherer Zeitrahmen ermöglicht es Händlern zu bewerten, ob sich Keile innerhalb größerer bullischer oder bärischer Trends bilden, was die Wahrscheinlichkeit erfolgreicher Ausbrüche erhöht.
Gold (XAU/USD) ist im Jahr 2026 das zuverlässigste Asset für Fortsetzungen durch fallende Keile, mit sauberer Preisaktion und konsistenter Volumenausweitung bei Ausbrüchen. Krypto profitiert von einer 24/7-Liquidität, was 4H-Keile „lückenlos“ und technisch genauer macht als Forex-Paare, die über Nacht Gaps aufweisen. Forex stellt Herausforderungen dar, da die durch NFP getriebene Volatilität Keile oft bricht, bevor sie den Apex erreichen, was Händler dazu zwingt, bei überraschenden Wirtschaftsdaten vorzeitig auszusteigen.
Technische Indikatoren für den Handel integrieren die Keilerkennung in automatisierte Systeme. Händler können Scanner verwenden, um Muster gleichzeitig über mehrere Assets und Zeitrahmen hinweg zu finden.
Unterschied zwischen Keil-, Wimpel- und Flaggenmustern
Die strukturelle Analyse zeigt, dass sich Keile, Wimpel und Flaggen in ihrer Trendlinienneigung und Dauer unterscheiden. Wimpel haben zwei konvergierende Trendlinien, die in entgegengesetzte Richtungen verlaufen (wie ein symmetrisches Dreieck), während Flaggen enge rechteckige Konsolidierungen ohne konvergierende Linien sind. Keile behalten parallel geneigte, konvergierende Trendlinien bei, was sie visuell von Wimpeln und Flaggen unterscheidet, obwohl sie ähnliche Funktionen bei der Volatilitätsexpansion erfüllen.
Auch die Richtungsneigung unterscheidet sich. Keile erben die Richtungsneigung vom vorangegangenen Trend, während Wimpel und Flaggen reine Fortsetzungen sind. Händler müssen zwischen diesen Mustern unterscheiden, um falsche Einstiege zu vermeiden, da ein Flaggenmuster nach einem gescheiterten Schlusskurs außerhalb des Konsolidierungshochs entwertet wird, während ein Keil gültig bleibt, solange der Preis innerhalb der Trendlinien bleibt.
Wichtige Erkenntnisse
- Keilmuster sind Chartformationen mit zwei konvergierenden Trendlinien, die in die gleiche Richtung verlaufen und eine Preiskonsolidierung vor einem Ausbruch anzeigen.
- Fallende Keile haben im Jahr 2026 eine Erfolgsquote von 70 % und übertreffen damit deutlich die bärischen steigenden Keile mit nur 49 % Genauigkeit.
- Die Verifizierung durch die „Dreierregel“ für Trendlinienberührungen ist obligatorisch. Muster mit zwei Berührungspunkten scheitern 72 % häufiger als korrekt gebildete Muster mit drei Berührungspunkten.
- Eine Volumenbestätigung von über 200 % über dem Durchschnitt ist entscheidend, um institutionelle Ausbrüche von falschen Signalen bei geringem Volumen und Bull Traps zu unterscheiden.
- Die Technik der „gemessenen Bewegung“ nutzt die Keilhöhe zur Projektion von Zielniveaus, was es Händlern ermöglicht, Risiko-Ertrags-Verhältnisse vor dem Einstieg festzulegen.
- Apex-Drifting (Seitwärtsbewegung am Apex ohne Volumenausweitung) entwertet das Muster und signalisiert einen Wechsel zu unruhigen, seitwärts gerichteten Märkten.
Häufig gestellte Fragen
Dieser Artikel enthält Verweise auf Handelskeilmuster, Chartmuster und Volity, eine regulierte CFD-Handelsplattform. Dieser Inhalt dient ausschließlich Bildungszwecken und stellt keine Finanzberatung oder Empfehlung zum Kauf oder Verkauf von Finanzinstrumenten dar. Überprüfen Sie immer den aktuellen regulatorischen Status und die Plattformdetails, bevor Sie einen Handelsdienst nutzen. Einige Links in diesem Artikel können Affiliate-Links sein.