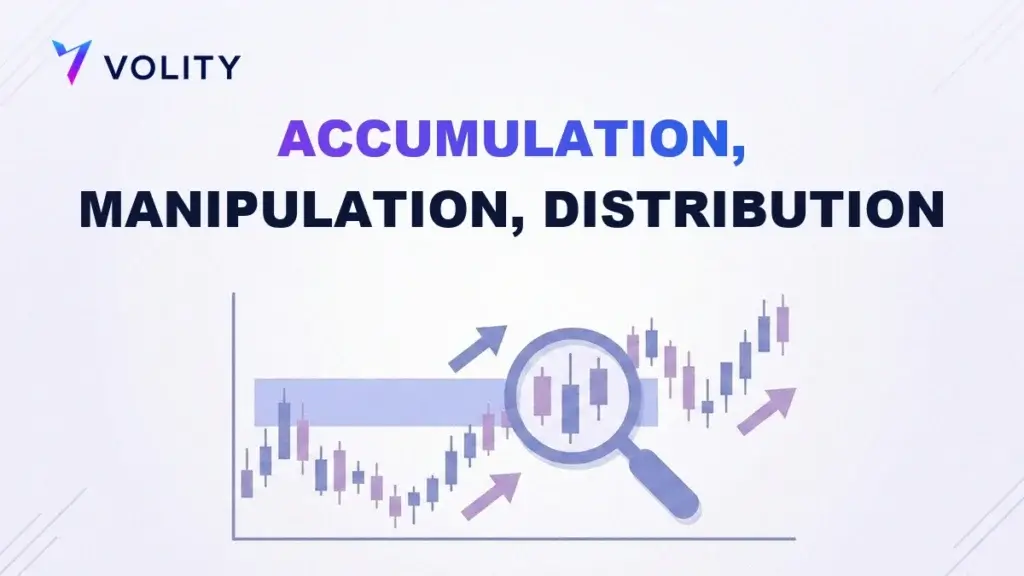
Accumulation, manipulation, distribution (AMD) is a three-phase model of how price moves. Large operators build a position quietly in a range, push price with a false move to trap traders and grab resting liquidity, then drive the real move as they realise the position. It explains why the first move so often traps you before the trend begins.
What is accumulation, manipulation, distribution (AMD)?
AMD reads price as a deliberate sequence rather than random movement. The idea traces back to the century-old work of Richard Wyckoff and was popularised in its modern form by the Inner Circle Trader. A large operator cannot fill a big position in one click, so it builds the position quietly, shakes out weak hands, then lets the market run so it can realise the position into willing counterparties. Those three needs map onto the three phases.
Once you can see AMD, a lot of frustrating price action starts to make sense. The range that chops you up is accumulation. The breakout that stops you out is manipulation. The trend you missed because you were stopped out is distribution. It is a core idea in the wider smart money approach to reading charts.
What are the three AMD phases?
| Phase | What happens | What it looks like |
| Accumulation | Smart money builds a position quietly in a range | Sideways consolidation, tight bars, low conviction |
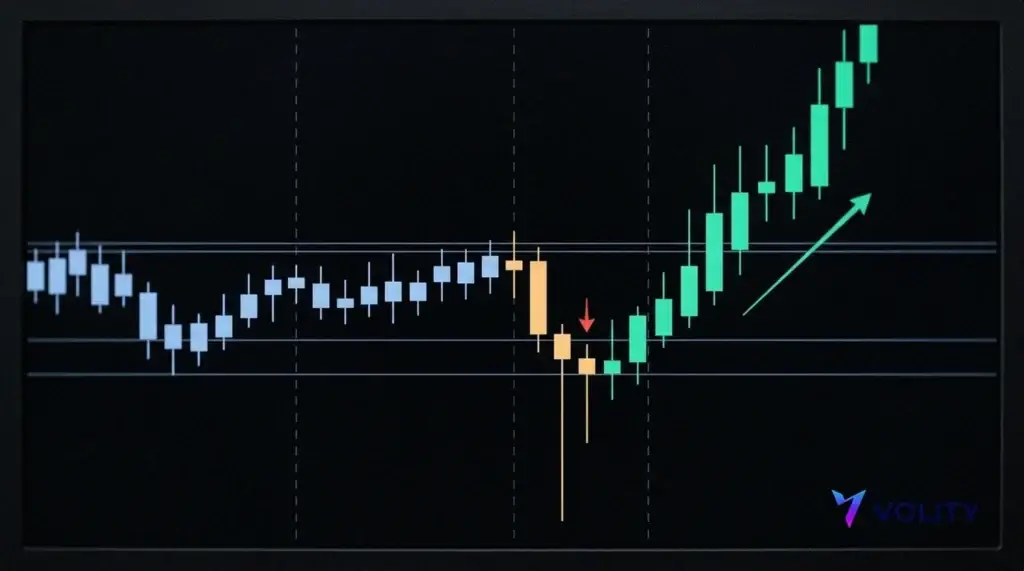
| Manipulation | A false move out of the range grabs liquidity and traps traders | A sharp break that fails and reverses, often on a long wick |
| Distribution | The real move unfolds and the position is realised | A strong, sustained trend in the opposite direction to the trap |
The accumulation phase is a stretch of sideways consolidation where nothing looks worth trading, which is exactly the point. Manipulation is the part traders feel most: it is built to look like the start of a move, so breakout traders pile in and stopped-out traders bail out, and both hand liquidity to the operators positioning for the real leg. Then comes distribution, the sustained move that pays. In a session context that false move even has its own name, the Judas swing.
How does AMD relate to the Power of 3?
They describe the same structure at different scales. The ICT Power of 3 applies the accumulation, manipulation, distribution sequence to a single candle or a single session: the open sits inside accumulation, a manipulation wick pushes one way to grab liquidity, and the distribution phase drives the candle to close near the opposite extreme. AMD is the broad framework and Power of 3 is the same idea compressed into one price bar, which is why the two pair so naturally.
How do you spot AMD on a chart?
- Find a clear consolidation range, ideally forming during a quiet session such as the late Asian hours.
- Mark the obvious liquidity: the highs and lows of the range where stop orders will sit.
- Watch for a sharp push through one side of the range that fails to hold. That is the manipulation, and it usually lands around a session open.
- Confirm the failure with a close back inside the range, often after price has reached toward resting liquidity and left a wick behind.
- Trade the distribution leg in the opposite direction to the trap, using structure to time the entry.
How do you trade the AMD model?
- Do not trade the accumulation range. It is chop with no edge.
- Do not chase the manipulation move. That is the trap, and buying or selling the break is exactly what it is engineered to make you do.
- Wait for the false break to fail, shown by price closing back inside the range after reaching for liquidity.
- Enter as distribution begins, when market structure shifts against the trap, with the stop beyond the manipulation extreme.
- Target the liquidity resting on the far side of the range, which the distribution leg is often built to reach.
The whole method is patience. Two of the three phases exist to pull you in early, and the profit lives in the third. Waiting for the manipulation to finish is the discipline that turns AMD from a nice theory into a plan.

When does AMD usually play out?
AMD is clearest on intraday charts tied to trading sessions. A common daily rhythm sees accumulation form during the quiet Asian session, manipulation strike around the London open as liquidity returns to the market, and distribution run through the London and New York overlap, when session volume is heaviest. The same shape appears on higher timeframes, where a multi-day range accumulates, a single day manipulates, and the following days distribute. That manipulation move at the open is the Judas swing, the piece most traders can learn to anticipate.
What are the common AMD mistakes?
- Trading the range burns capital, because accumulation is designed to be directionless.
- Chasing the fake-out is the classic trap, since the manipulation leg is meant to look like the real move.
- Forcing the pattern onto every chart. Not every range resolves as clean AMD, and if the false break never fails you stand aside.
- Ignoring sessions strips out half the context, because AMD runs on liquidity cycles that track the trading day.
How long does each AMD phase last?
There is no fixed clock, because accumulation, manipulation, distribution scales with the timeframe you read it on. What stays constant is the relative rhythm of the three phases, and knowing that rhythm helps you judge where you are in the cycle.
- Accumulation is usually the longest. On an intraday chart this is often the quiet Asian range, building over several hours. It is slow by design, because quiet, sideways price is how a large position gets built without moving the market.
- Manipulation is fast. The false move that grabs liquidity can be over in minutes, typically striking around a session open. It is meant to be sharp, because its job is to trap quickly and take stops.
- Distribution is the sustained move. Once the trap is set, the real trend can run for the rest of the session or the day, which is where the tradeable range lives.
Scale the same shape up and the proportions hold. On a higher timeframe, accumulation might be a multi-day range, manipulation a single day, and distribution the following several days. On a lower timeframe the whole cycle can complete inside one session. The lesson is less about memorising exact durations and more about reading the character of each phase: patient accumulation, a sharp manipulation, then a committed distribution leg. Read the character, and you can place yourself in the cycle even when the clock times differ from one market to the next.
Putting AMD to work on Volity
AMD is a session-driven model, so it rewards a platform you can watch across the whole trading day. Volity gives you CFD trading across forex, indices, commodities and crypto from one account, so you can track accumulation on a forex pair and distribution on an index without switching brokers, all on Volity MT under CySEC regulation through UBK Markets (licence 186/12). The charts on the Volity platform let you map a session range and mark the manipulation extreme for your stop. Because CFDs are leveraged, they carry a high risk of losing money quickly, and regulators such as ESMA and the FCA restrict how they are sold to retail traders, so size every position from its stop and confirm your instrument’s spread and swap on the charges and fees page. You can open an account for nothing, rehearse the setup on a demo, and start trading from $1 once you can wait out the trap.
AMD FAQ
What does AMD stand for in trading?
AMD stands for accumulation, manipulation, distribution. It describes a three-phase sequence in which large operators build a position in a range, push price with a false move to grab liquidity and trap traders, then drive the real trend and realise the position. It is a core concept in smart money and Inner Circle Trader material.
Is AMD the same as Wyckoff accumulation and distribution?
They share the same roots. Richard Wyckoff described accumulation and distribution ranges decades ago, and AMD adds an explicit manipulation phase between them, framed around liquidity and session timing. The spirit is identical to that century-old Wyckoff logic: informed operators build and unload positions while the crowd is misled. AMD is the modern, intraday-focused expression of that older idea.
Which phase of AMD should I trade?
The distribution phase. Accumulation is a directionless range, and manipulation is the trap that catches traders who act too early. The edge lies in entering as distribution begins, once the false break has failed and structure shifts in the opposite direction. Trading the first two phases is usually how AMD costs traders money rather than makes it.
Does AMD work on all markets?
Yes. AMD is a liquidity-based model, so it applies to any market with resting orders and session-driven flow, including forex, index CFDs, gold and crypto. Session timing is clearest in forex, but the accumulate, manipulate, distribute shape shows up across assets and timeframes wherever a crowd of stops can be engineered and taken.